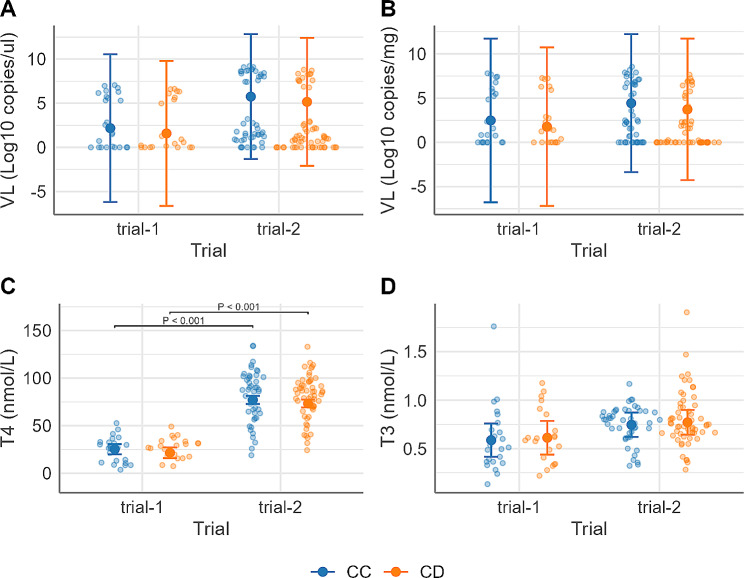
Fig. 4.
Estimated marginal means (EMM) of fetal viral loads and circulating thyroid hormones by Asn91Ser genotype (CC, CD) for each trial (trial-1 [6], trial-2 [14]). (A) viral load (VL) in serum (log10 copies/µl); (B) viral load (VL) in thymus (log10 copies/mg); (C) T4 level (nmol/L); (D) T3 level (nmol/L). Large central dots and associated vertical lines represent the EMM and 95% confidence interval, respectively. Overlapping small dots are raw data. Different y-axis scales used between (C) and (D). P values for coefficients of genotype or trial are shown in the plots if significant at P < 0.05. Fetal counts in each genotype within each trial: CC = 24, CD = 21, in trial-1; CC = 47, CD = 59, in trial-2 (1 CD fetus from trial-2 excluded for T3 level after residual analyses)

