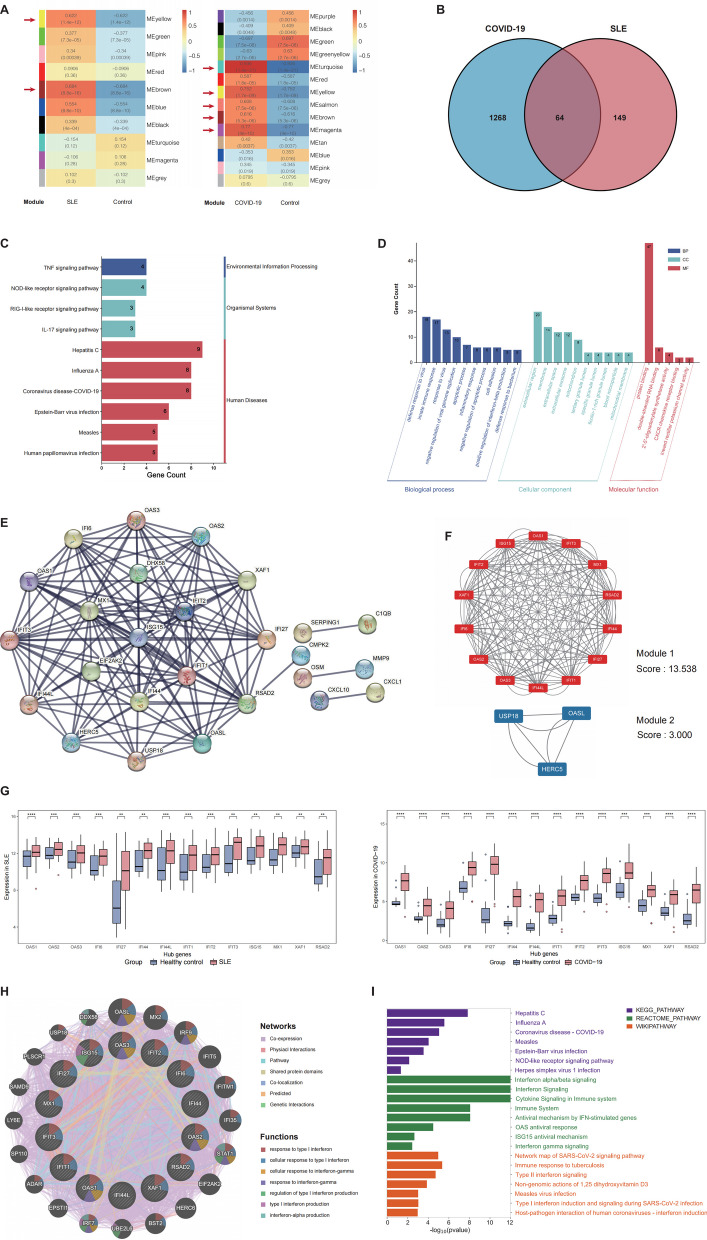
Fig. 1.
Hub genes of COVID-19 and SLE enriched in IFN-I/II-related signature. A Heatmap showing correlation coefficients and P-values of comparisons between clinical traits (COVID-19, SLE, and Control) and gene modules in the weighted gene co-expression network analysis. Modules with a correlation coefficient > 0.6 and P-value < 0.05 were identified as key gene modules (indicated by the red arrows in the figure); B Venn diagram showing the 64 common genes obtained after intersecting the key gene modules for SLE and COVID-19; C KEGG enrichment for common genes (P-value < 0.05); D GO term enrichment for common genes (P-value < 0.05); E PPI network for common genes at the highest confidence, which shows significant interactions between genes. The connecting line indicates the presence of an interaction, and the thickness of the line represents the confidence level, with a thicker line indicating higher confidence; F submodules 1 and 2 extracted from MCODE; G boxplots illustrating the variations in the expression levels of hub genes in SLE and COVID-19, where dots represent outliers (*P < 0.05, **P < 0.01, ***P < 0.001, ****P < 0.0001); H co-expression network for hub genes showing the IFN-related enrichment results with the lowest FDR; I pathway enrichment analysis for hub genes from KEGG, WIKI, and REACTOME databases (P-value < 0.05). ME module eigengene, BP biological process, CC cellular component, MF molecular function, FDR false discovery rate

