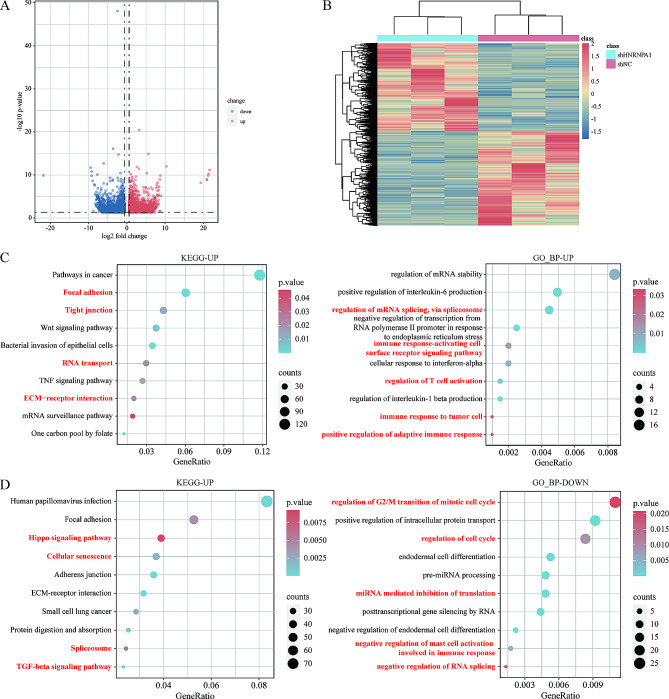
Fig. 2.
Identification and Functional Enrichment Analysis of DEGs in shHNRNPA1 SKOV3 cells. (A) The volcano plot of the differentially expressed genes in shHNRNPA1 SKOV3 cells. The threshold is fold change > 1.5 and P value < 0.05. The up-regulated genes are shown in red, while the down-regulated genes are shown in blue. (B) Heatmap of a total of 5348 DEGs (n = 3). (C) Enriched KEGG and GO terms based on up-regulated DEGs (P value < 0.05). (D) Enriched KEGG and GO terms based on downregulated DEGs (P value < 0.05)

