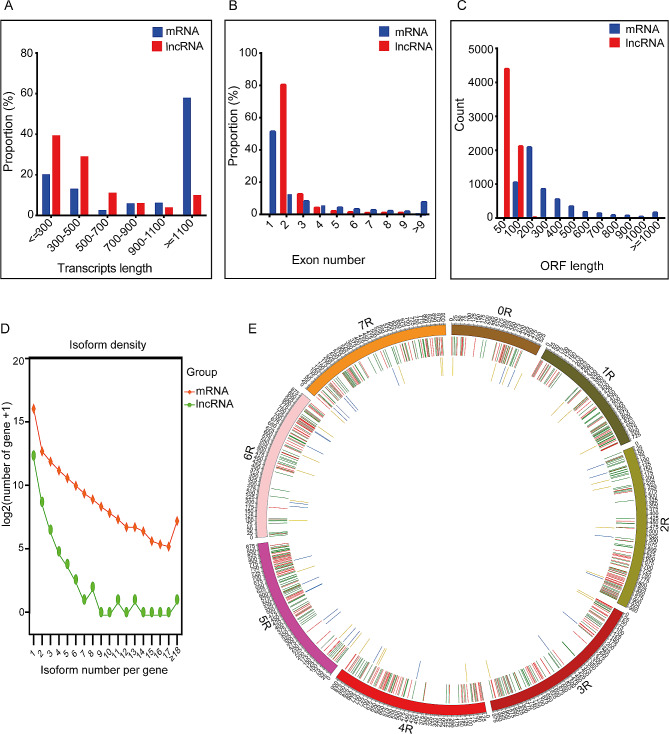
Fig. 4.
Comparative analysis of lncRNAs and mRNAs. Transcript length distribution (A), number of exons (B), length of ORF (C), alternative splicing event isoform diversity (D), and visualisation of DE-mRNAs and lncRNAs in the reference genome (E): The outer circle represents the chromosomes based on the reference genome; the centre circle depicts the distribution of mRNAs on the chromosomes; and the inner circle represents the distribution of lncRNAs; upregulated DE-mRNAs are shown in red, while downregulated DE-mRNAs are shown in green. Upregulated DE-lncRNAs are highlighted in yellow, and downregulated DE-lncRNAs are highlighted in blue

