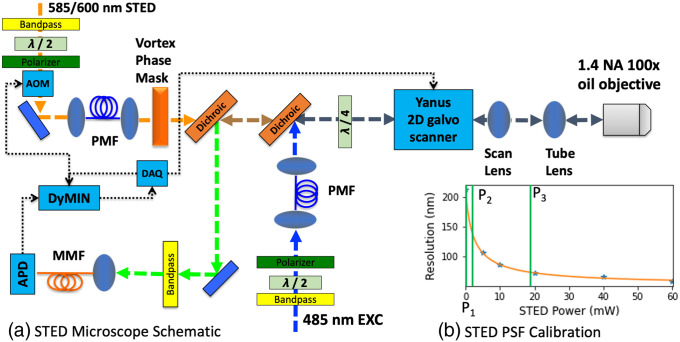
Fig. 3.
(a) Schematic of custom-built STED microscope for imaging YFP/GFP with 485 nm excitation laser and 585/600 nm STED laser. Both excitation/STED beams pass through a bandpass filter and a half waveplate and polarizer for power control. An AOM in the STED laser path controls the STED power for the DyMIN algorithm. The lasers are each coupled into a PM fiber, collimated, and the STED laser is sent through a vortex phase mask before being combined with the excitation laser using a dichroic. A quarter waveplate sets the polarization to be circular, followed by the Yanus 2D galvo scanning system, scan lens, tube lens, and objective lens, which focuses the beams onto the sample. The resulting fluorescence is selected using a dichroic and bandpass filter, coupled into a multimode fiber that acts as a confocal pinhole, then sent to the APD. (b) The STED resolution calibration curve. The resolution of the STED microscope at a series of STED laser power values was estimated by imaging 23 nm fluorescent beads. These values were fit to a curve (orange line) using Eq. (1). Example values from our bead imaging experiments of , , and are indicated with green vertical lines.

