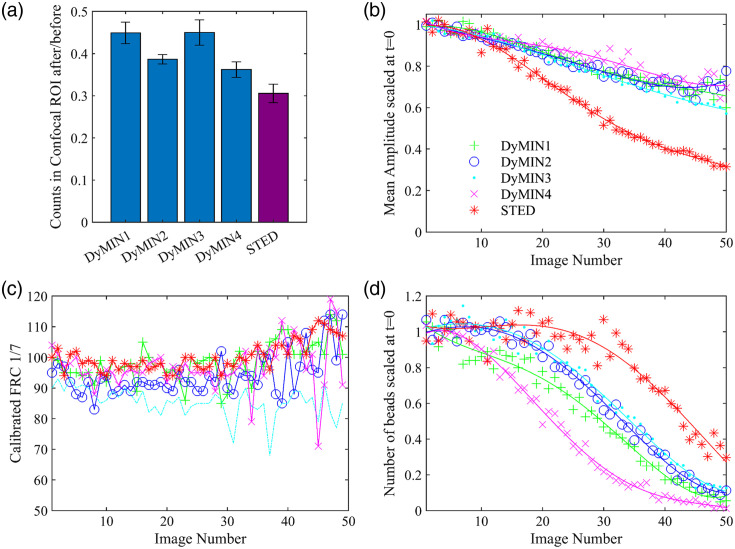
Fig. 5.
Analysis of photobleaching and resolution for DyMIN and STED images of fluorescent beads. (a) The ratio of the total confocal fluorescence counts in the DyMIN/STED imaging ROI [shown in Fig. 4(a)] after the 50-image sequence compared to before. Error bars were calculated by splitting the ROI into nine equal regions and calculating the standard deviation. (b) The mean amplitude of 2D Lorentzian fits of the beads verses image number, scaled to the mean of the initial three values. Fits were performed on a ROI around the bead center, selected using a peak finding routine in MATLAB. The lines are fourth degree polynomial fits to guide the eye. (c) The FRC, calculated with a fixed 1/7 threshold, verses image number, with the FRC calculated between subsequent images of the sequence (), with individual curves for each image sequence. The close initial values indicate that the STED powers were equivalent during imaging. (d) The number of beads fit in panel (b) verses image number, scaled to the mean of the initial three values, also with a fourth degree polynomial fit. All traces in panels (b)–(d) use the color and marker scheme shown in the legend in panel (b).

