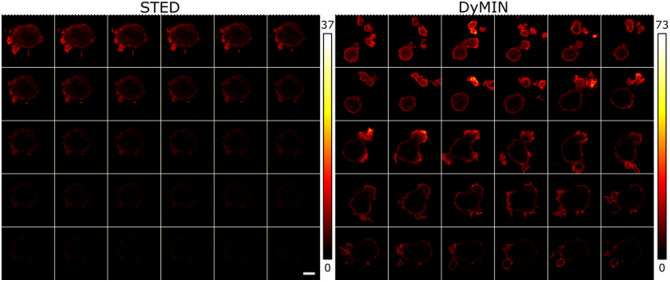
Fig. 6.
A sequence of 30 images (left to right, top to bottom), taken 30 s apart, with a FOV with of wild type T cells expressing lifeactGFP. A scalebar is shown in the bottom right STED image. The STED sequence on the left quickly bleaches so that by the middle of the sequence the image is no longer visible on the same scale as the first image, whereas the DyMIN sequence is still visible even on the 30’th image. The DyMIN settings were , counts and . A dwell time of was used for the conventional STED sequence at .

