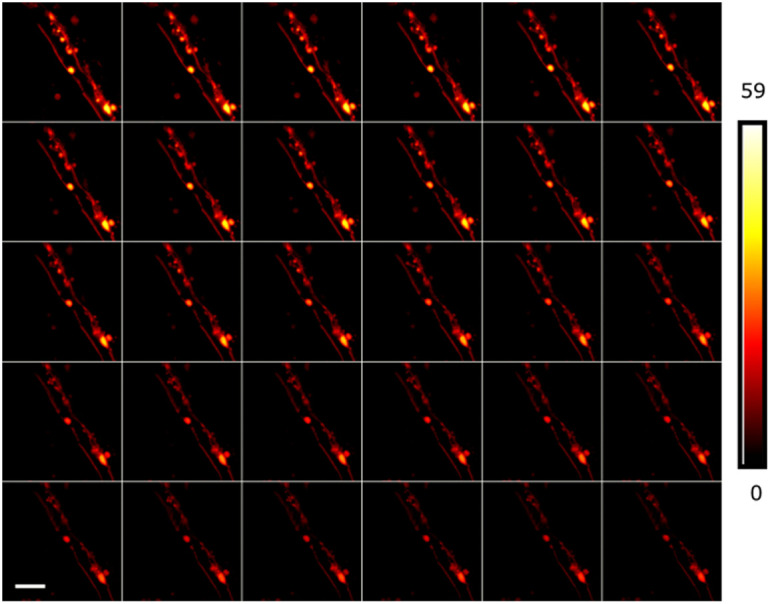
Fig. 7.

Time series images of a live cerebellar brain slice from a PLP-eGFP mouse using DyMIN imaging (left to right, top to bottom). A FOV with was imaged using DyMIN parameters counts, and with powers of . A 30 image timeseries was taken at 30 s between the start of each image. The sample remains visible throughout the entire imaging sequence. A scalebar is shown in the bottom left image.
