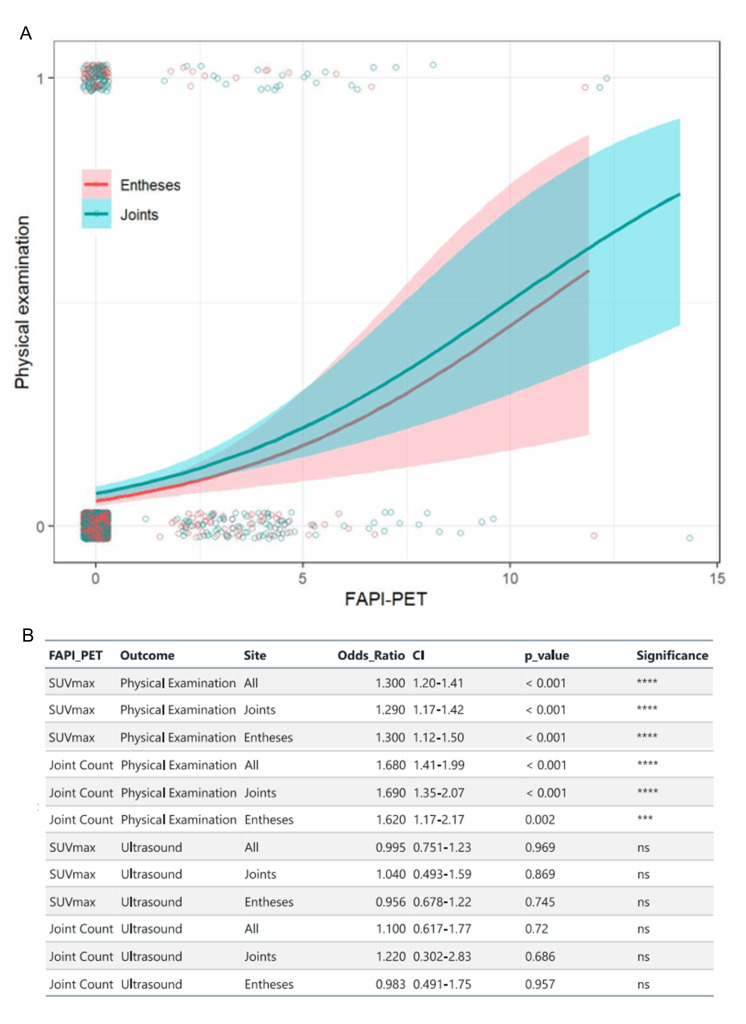
Figure 2.
(A) Logistic regression model of clinical examination findings in joints and entheses with 68Ga-FAPI-04 uptake. Regression curves are represented in blue for joints and red for entheses. Shaded areas represent the 95% CI. Points represent individual clinical and imaging findings. (B) Relationships between clinical and ultrasound findings and maximal standardised uptake values (SUVmax) and PET/CT Joint Index. 68Ga-FAPI-04, 68gallium-labelled FAPI-04; FAPI, fibroblast activation protein inhibitor; ns, not significant; PET, positron emission tomography. ****: p<0.001; ***: p<0.01.

