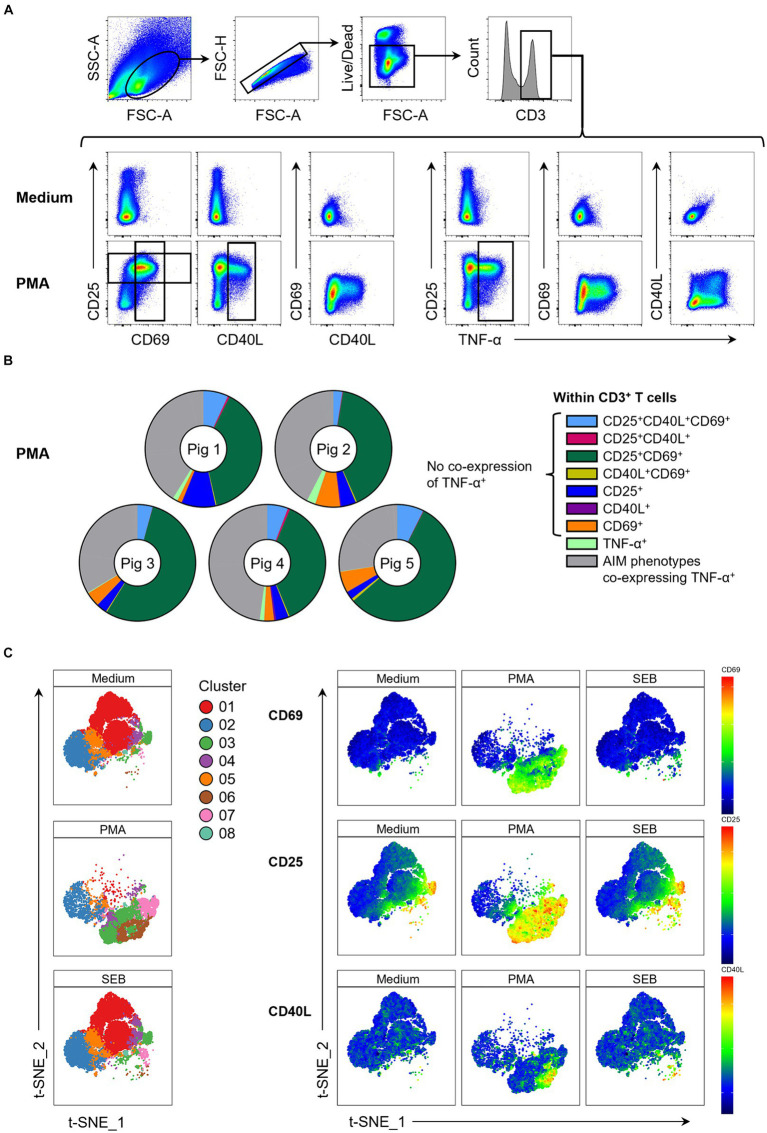
Figure 1.
Expression of AIMs in blood-derived CD3+ T cells after stimulation with PMA/ionomycin. (A) Representative FCM plots depicting expression of CD25, CD69, CD40L and TNF-α in CD3+ T cells when PBMC samples were unstimulated (Medium, top row) or stimulated with PMA/ionomycin (PMA, bottom row) for 18 h. Surface staining was performed for antibodies against CD3, CD4, CD8α, CD25 and CD69. Intracellular staining was performed for CD40L and TNF-α. Gates shown are representative of gating for total CD25+, total CD69+, total CD40L+ and total TNF-α+ T cells applied to PMA-stimulated samples and used in Boolean gating to create doughnut charts. (B) Doughnut charts of AIM phenotypes in PMA-stimulated samples generated by Boolean gating. Each doughnut represents the PBMC sample of one pig. Different phenotypes are indicated by different colors with all AIM phenotypes co-expressing TNF-α summarized in gray. CD25−CD40L−CD69−TNF-α− T cells are not shown. (C) Live CD3+ T cells from unstimulated (Medium), SEB-stimulated and PMA-stimulated cultures were clustered using the t-SNE algorithm with generated clusters shown in a colored overlay (left side). Relative expression levels of CD69, CD25 and CD40L within clusters (right side) are colored from high (red) to low (blue).

