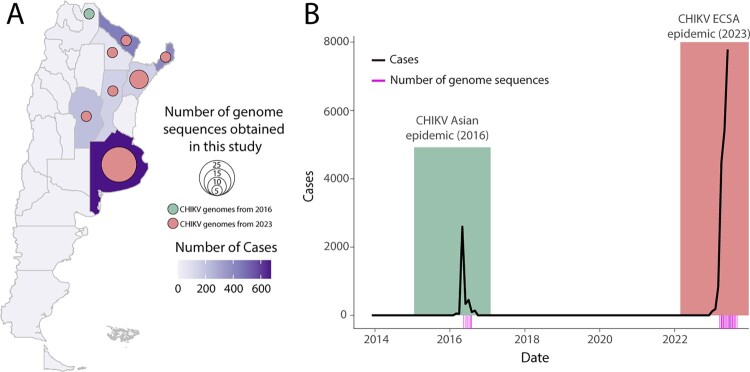
Figure 1.
Spatiotemporal Dynamics of CHIKV in Argentina. A) A map of Argentina shows districts coloured according to the number of reported CHIKV cases. Circles indicate the number of CHIKV genome sequences generated in this study, with the size of each circle representing the number of genomes isolated from that specific district. B) The number of autochthonous chikungunya cases reported weekly per 100,000 individuals from 2014 to 2023. The 2016 epidemic is highlighted in green, while the 2023 epidemic is highlighted in salmon. Pink bars represent the sample collection dates for the genomes generated in this study.

