
FIGURE 2.
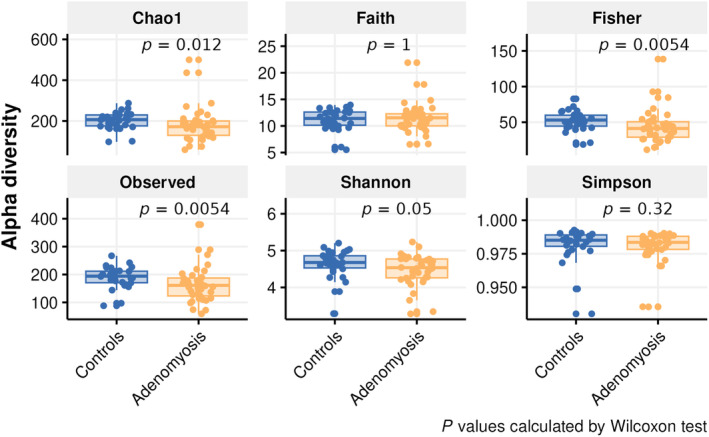
Boxplots representing alpha diversity analysis results for fecal samples including Chao1, Faith's PD, Fisher, observed species, Shannon, and Simpson indexes. The Chao1 (p = 0.012), Fisher (p = 0.005), and the observed species (p = 0.005) in the fecal samples of the control group were significantly higher than in the adenomyosis group (p < 0.05).