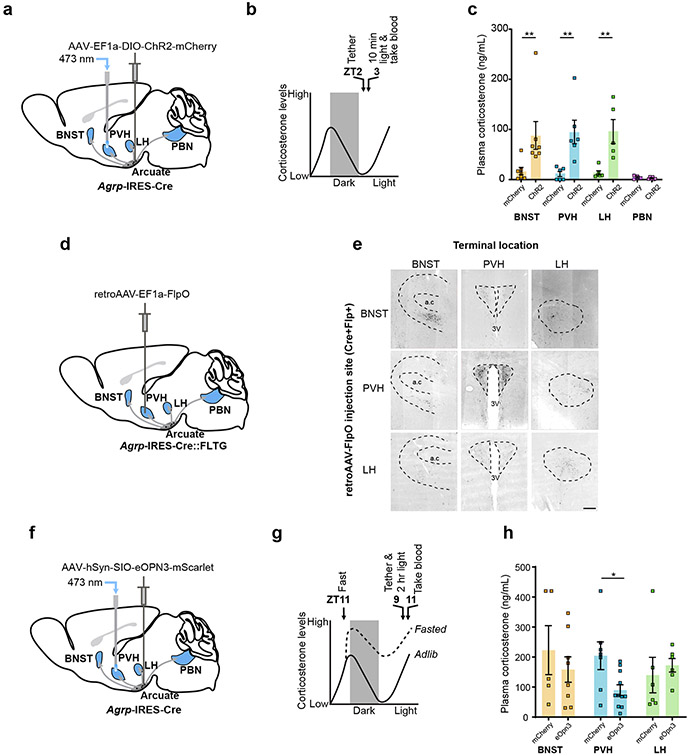
Figure 2. AgRP neurons regulate the HPA axis via projections to the PVH.
a, Schematic of terminal optogenetic stimulation of AgRP neurons. The optic fiber was placed over the PVH (example), BNST, LH or PBN. b, Time-line for optogenetic stimulation of AgRP neuron terminals. c, Plasma corticosterone levels from mice that received optogenetic stimulation of AgRP neuron terminals in the BNST, PVH, LH or PBN (BNST: n = 7 AgRPmCherry, n = 7 AgRPChR2. Mann-Whitney test- **P = 0.0041, PVH: n = 6 AgRPmCherry, n = 6 AgRPChR2. Mann-Whitney test- **P = 0.0022, LH: n = 6 AgRPmCherry, n = 5 AgRPChr2. Mann-Whitney test- **P = 0.0043, PBN: n = 4 AgRPmCherry, n = 6 AgRPChR2. Mann-Whitney test- P = 0.4762). d, Schematic of collateral mapping via injection of retro-AAV-FlpO into Agrp-IRES-Cre::FLTG mice. e, AgRP neuron terminals detected upon injection of retro-AAV-FlpO into individual AgRP neuron efferent sites (denoted by row headings) in Agrp-IRES-Cre::FLTG mice. a.c: anterior commissure, 3V: third ventricle. f, Schematic of terminal inhibition of AgRP neurons. The optic fiber was placed over the PVH (example), BNST or LH. g, Time-line for optogenetic inhibition of AgRP neuron terminals and collection of trunk blood. h, (BNST: n = 5 AgRPmCherry, n = 8 AgRPeOpn3. Mann-Whitney test- P = 0.4973, PVH: n = 6 AgRPmCherry, n = 11 AgRPeOpn3. Mann-Whitney test- *P = 0.0154, LH: n = 6 AgRPmCherry, n = 6 AgRPeOpn3. Mann-Whitney test- P = 0.2403). Scale bar = 200 μm. Data represent = mean ± sem.

