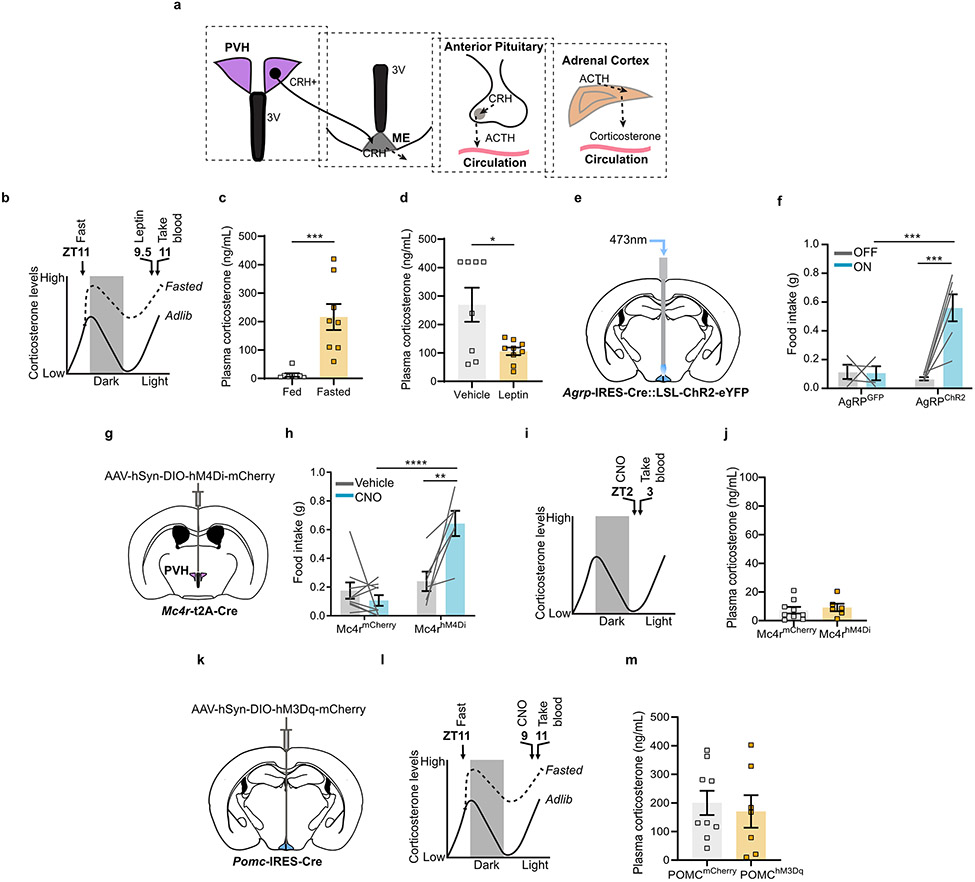
Extended Data Fig. 1. Fasting activation of the HPA axis is regulated by leptin but not by the arcuate PVH melanocortin system.
a, Scheme of the HPA axis. b, Time-line for leptin injection. c, Corticosterone levels were elevated in mice fasted for 24 hours compared to fed mice (n = 8 per group. Two-tailed unpaired t-test- ***P = 0.0006). d, I.P. administration of leptin reduced corticosterone levels in fasted mice (n = 8 vehicle, n = 9 leptin. Two-tailed unpaired t-test- *P = 0.0130). e, Schematic of optogenetic stimulation of AgRP neurons. f, One hour food intake by Agrp-IRES-Cre mice expressing ChR2 or GFP in the arcuate (n = 4 AgRPGFP, n = 6 AgRPChR2. Two-way ANOVA; Sidak’s multiple comparisons test. AgRPGFP ON vs. AgRPChR2 ON- ***P = 0.0008; AgRPChR2 OFF vs. AgRPChR2 ON- ***P = 0.0001). g, Schematic of Cre-dependent AAV-hM4Di-mCherry stereotaxic injection into the PVH of Mc4r-t2A-Cre mice. h, Three hour food intake by Mc4r-t2A-Cre mice expressing hM4Di or mCherry in the PVH (n = 9 MC4RmCherry, n = 6 MC4RhM4Di. Two-way ANOVA; Sidak’s multiple comparisons test. MC4RmCherry CNO vs. MC4RhM4Di CNO- ****P = <0.0001; MC4RhM4Di Vehicle vs. MC4RhM4Di CNO- **P = 0.0015). i, Time-line for chemogenetic inhibition of PVHMc4r neurons. j, Inhibition of PVHMc4r neurons did not affect corticosterone in fed mice (n = 9 MC4RmCherry, n = 6 MC4RhM4Di. Two-tailed unpaired t-test- P = 0.5933). k, Schematic of Cre-dependent AAV-hM3Gq-mCherry stereotaxic injection into arcuate nucleus of Pomc-IRES-Cre mice. l, Time-line for chemogenetic activation of POMC neurons. m, Activation of POMC neurons did not affect corticosterone in fasted mice (n = 9 POMCmCherry, n = 7 POMChM3Gq. Two-tailed unpaired t-test- P = 0.6736). Scale bar = 200 μm. Data represent = mean ± sem.

