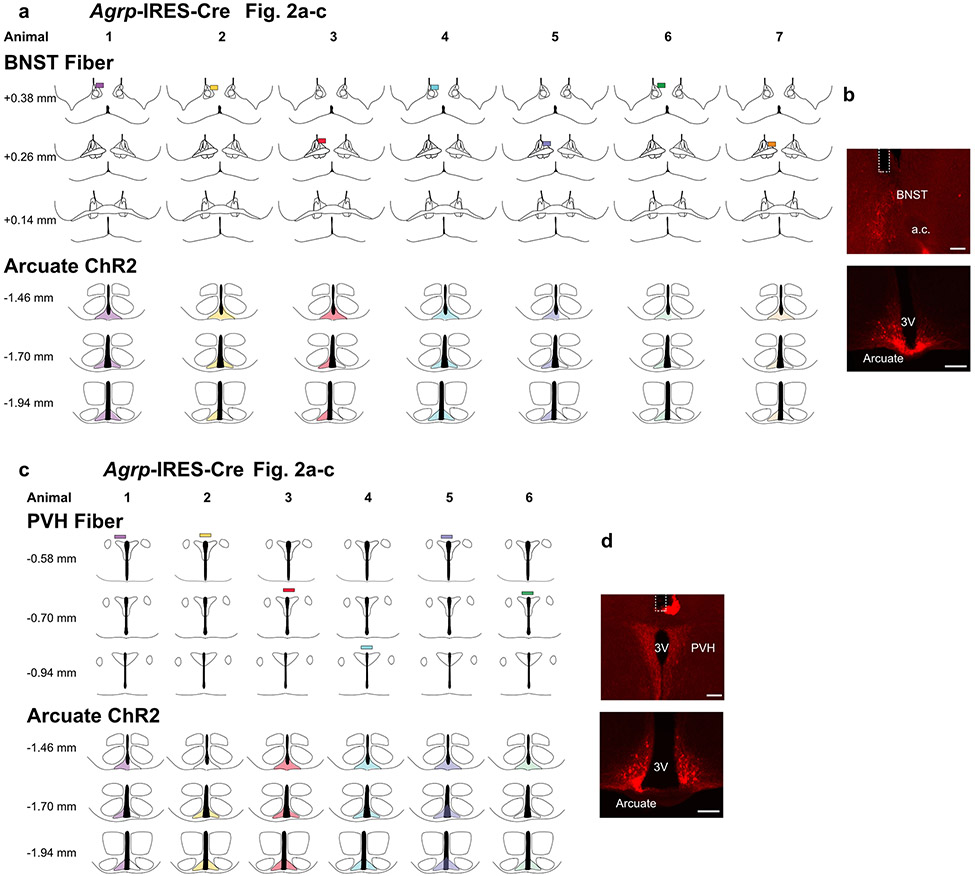
Extended Data Fig. 4. Schematic of AAV spread and fiber placements in Agrp-IRES-Cre mice.
a, Schematics representing AAV spread (shaded regions) and fiber placements (rectangles) for every animal related to experiments in Fig. 2a-c. Each animal is represented by a different colour. b, Representative images of ChR2-mCherry expression in AgRP neuron somas in the arcuate nucleus and fiber placement in the BNST. c, Schematics representing AAV spread (shaded regions) and fiber placements (rectangles) for every animal related to experiments in Fig. 2a-c. Each animal is represented by a different colour. d, Representative images of ChR2-mCherry expression in AgRP neuron somas in the arcuate nucleus and fiber placement in the PVH. Scale bar = 200 μm. 3V = Third ventricle. a.c. = anterior commisure. The schematics were created using The Mouse Brain in Stereotaxic Coordinates Second Edition (Paxinos and Franklin).

