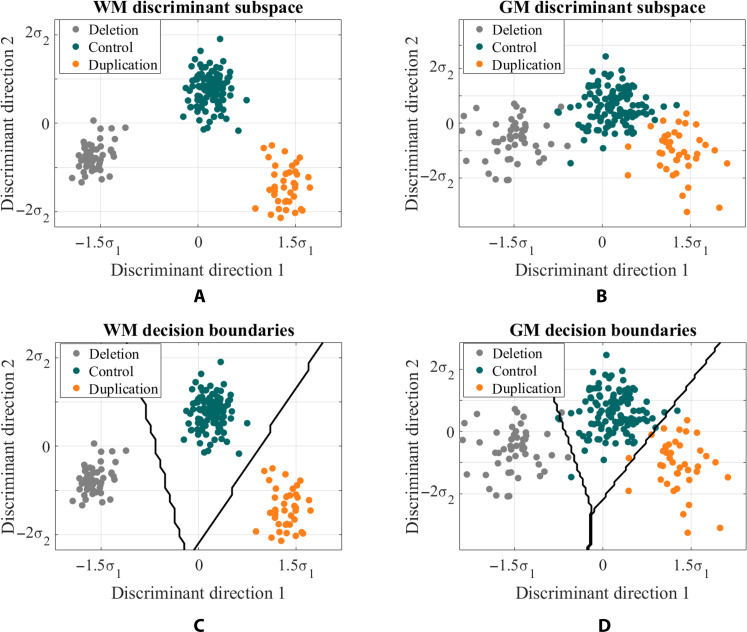
Fig. 3. 3D TBM discriminant subspace.
Each subject in the study is represented by a point on the scatterplot. Subject data is projected onto the most discriminant subspace computed by pLDA for (A) white matter (WM) and (B) gray matter (GM). Boundaries between the classes computed based on nearest centroid classification for (C) white matter and (D) gray matter.

