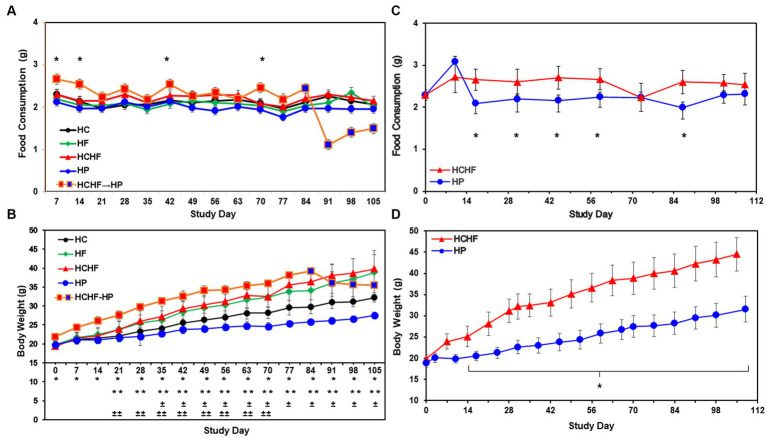
Figure 2.
Results from the four-dietary pattern and two-dietary pattern studies after 15 weeks. (A) Average daily consumption of food is presented per mouse per day. Following quarantine, mice were fed either the HC, HF, HCHF, or HP diets for 15 weeks (n = 5 mice/diet group). One group of mice fed the HCHF diet for 12 weeks was crossed over to the HP diet for the remaining 3 weeks (orange box changes to blue box on Day 84). Error bars are based on the standard error of the average of food consumed per time-point/diet. No significant differences between the HC diet and any other diet in pair-wise t-tests. Significance was found on 4 days between the HCHF→HP and HP, p < 0.05 (*) by t-test, but not rigorous enough to detect significance after Day 84. (B) Average body weight change results from four-dietary pattern 15-week study. Differences in weight gain were significant between mice fed the HC diet vs. all other diets and for mice fed the HP diet with all other diets. Error bars are based on standard deviation. Significant differences determined by t-test at p < 0.001 as follows: HCHF→HP vs. HP (*), HC vs. HCHF and HCHF vs. HP (**), HC vs. HP (±) and HC vs. HF (±±). (C) Average daily consumption of food is presented per mouse per day. Following quarantine, mice were fed either the HP or HCHF diet for 15 weeks (n = 8 mice/diet group). Error bars are based on the standard deviation of average food consumed per mouse/per day at each time point for both diets. Significance (HCHF vs. HP), at least p < 0.0001 (*), by t-test. (D) Average body weight changes in the two-dietary pattern follow-up study. Differences in weight gain were significant between the two dietary groups after the second week of the study. Body weight changes continued to increase throughout the study, with no plateau observed for either diet group. Error bars are based on the standard error of the average of food consumed per time-point/diet. Significance (HCHF vs. HP), p < 0.0001 (*), by t-test. HC, high carbohydrate; HF, high fat; HCHF, high carbohydrate + high fat; HCHF→HP, high carbohydrate + high fat crossed over to high protein with higher fiber; HP, high protein with higher fiber.

