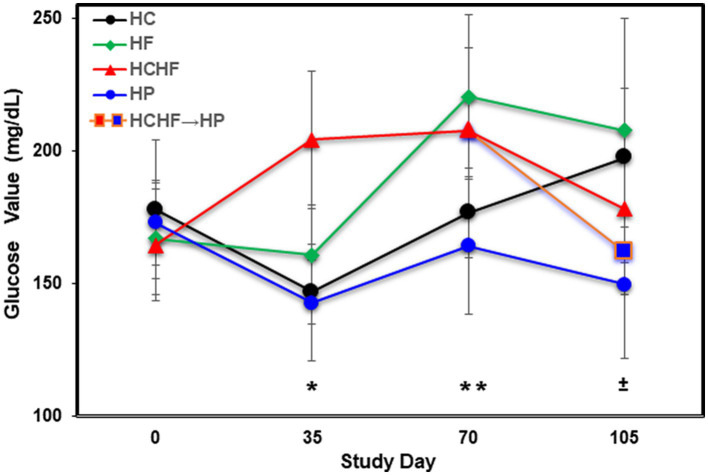
Figure 3.
Averaged blood glucose levels (mg/dL) in five mice per dietary pattern measured every 5 weeks over 15 weeks on Days 0, 35, 70, and 105. Mice on the HCHF diet were switched to the HP diet on Day 84, denoted by HCHF→HP. Error bars based on standard deviation. Differences in glucose levels were determined significant by t-test on Day 35 between mice fed the HC vs. HCHF diets and the HP vs. HCHF diets (*, p < 0.001), on Day 70 between mice fed the HC vs. HF diets and the HCHF vs. HP diets (±, p < 0.05), and on Day 105 between mice fed the HC vs. HP and HCHF→HP diets, and between the HF vs. HP diets (**, p < 0.05). Error bars are based on standard deviation. HC, high carbohydrate; HF, high fat; HCHF, high carbohydrate + high fat; HCHF→HP, high carbohydrate + high fat crossed over to high protein with higher fiber; HP, high protein with higher fiber.

