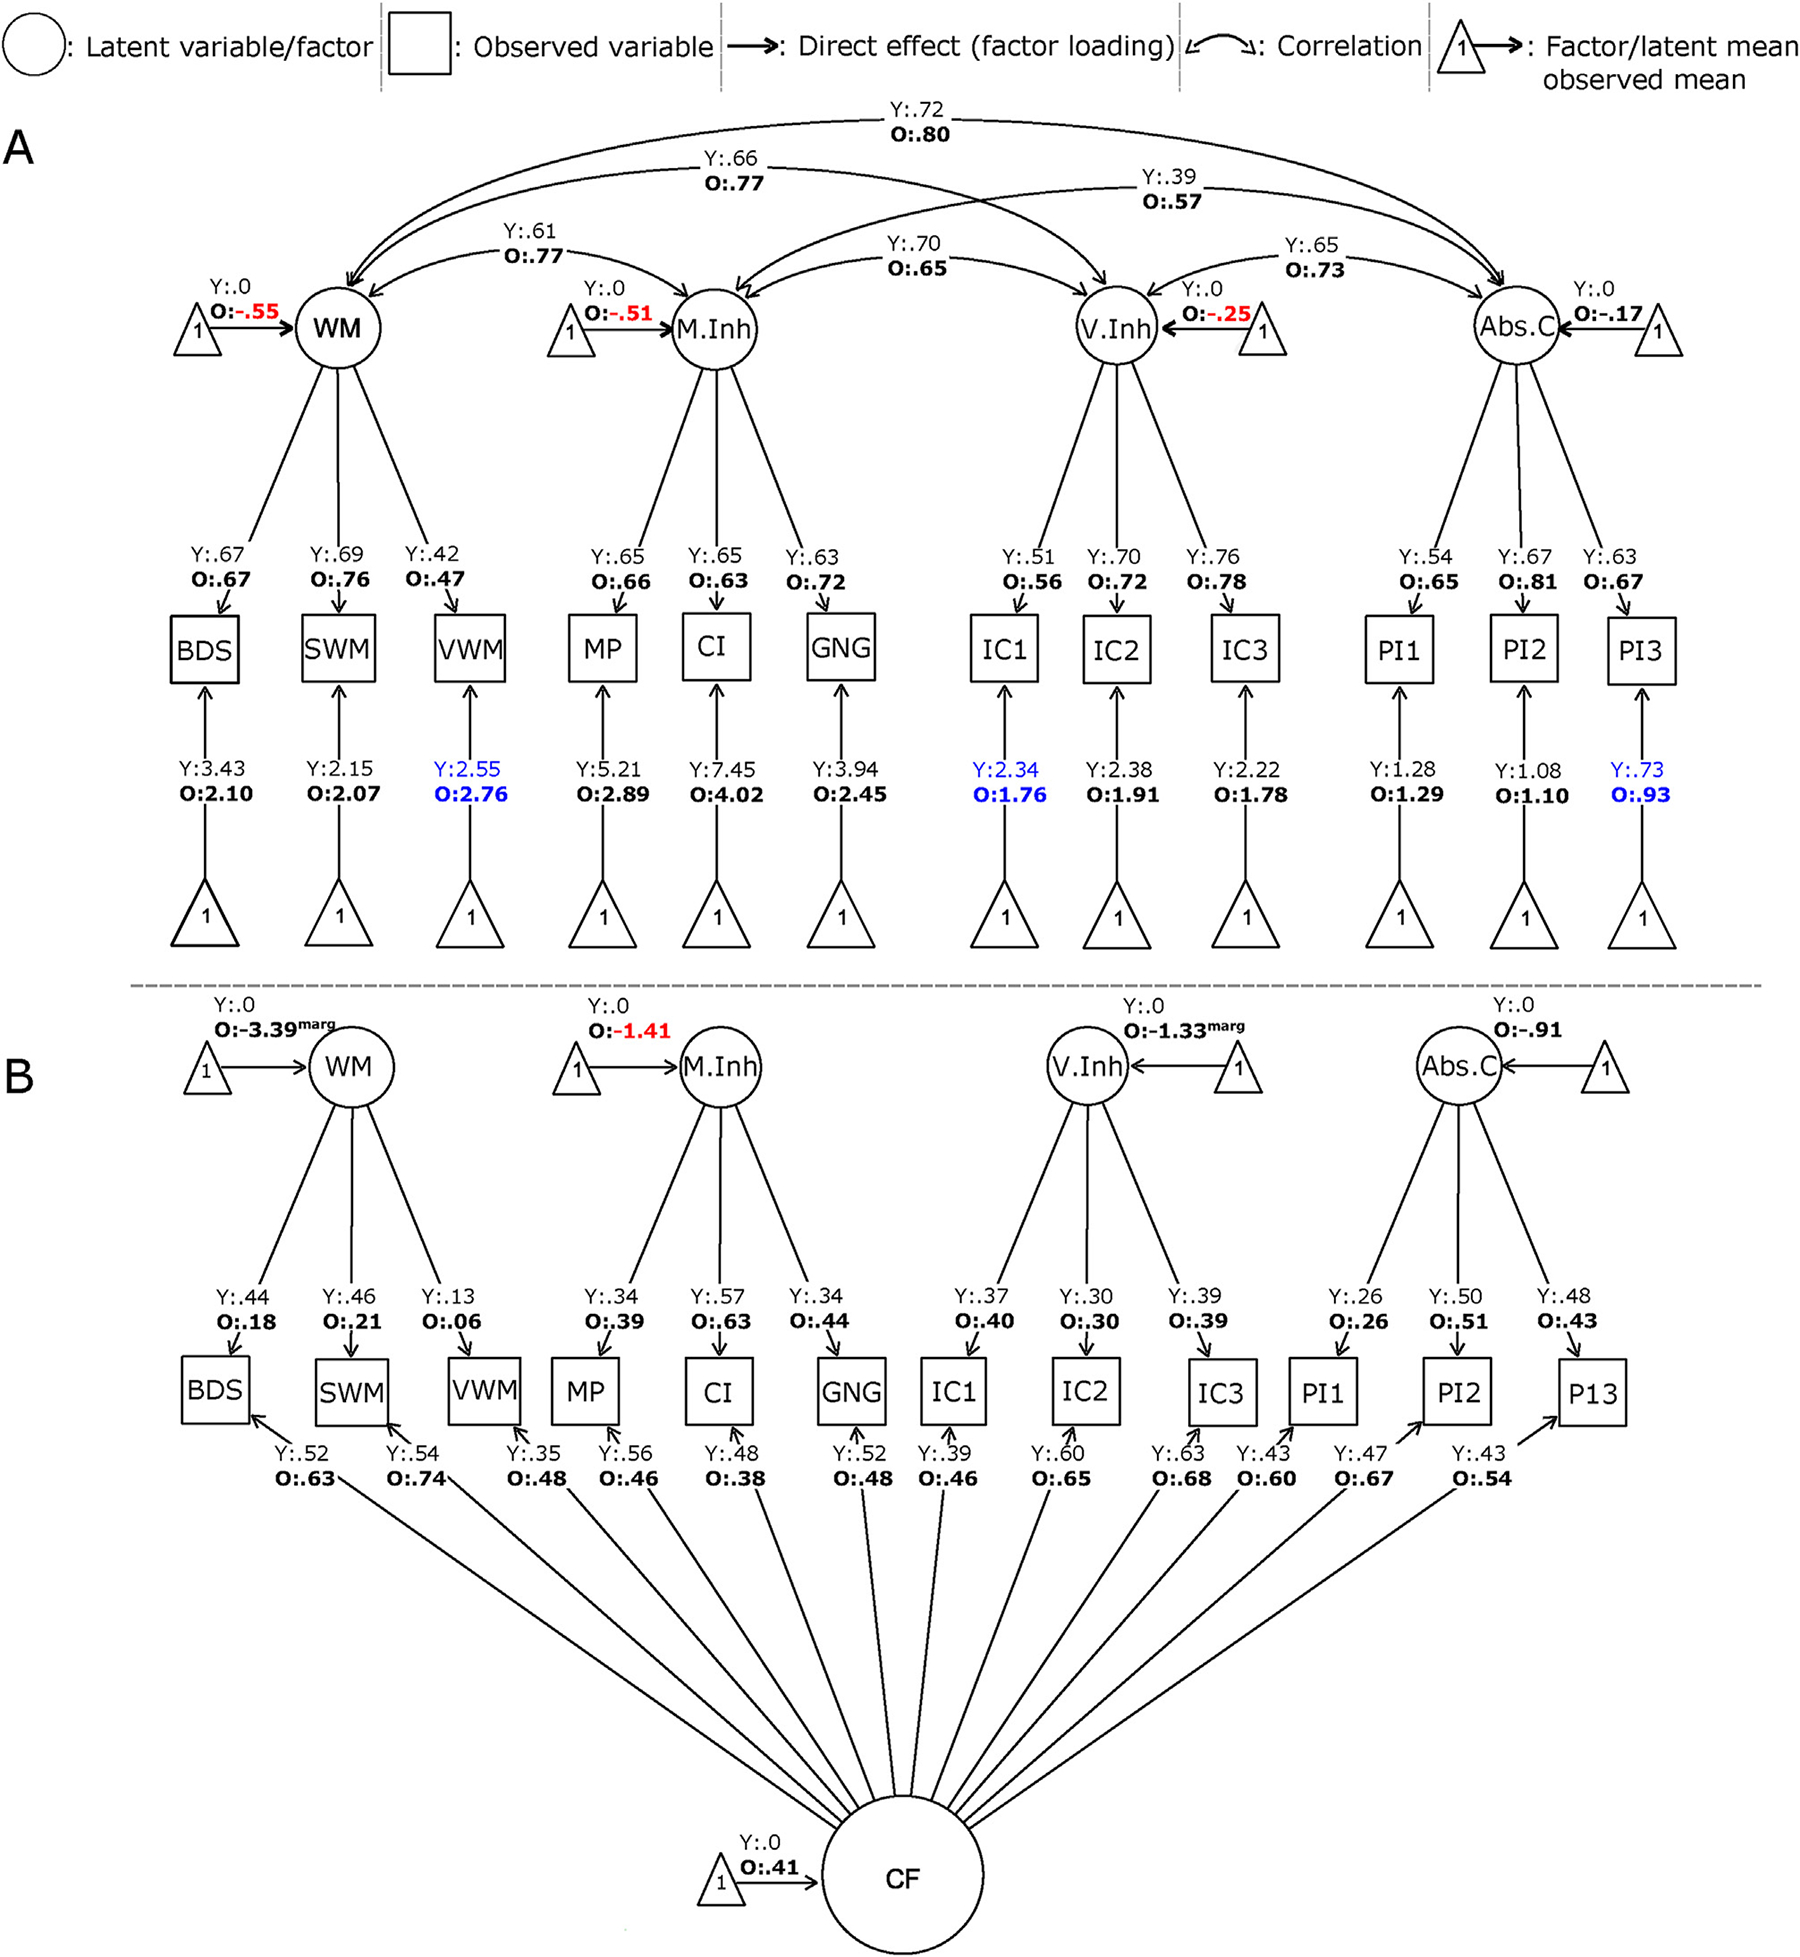
Fig. 1 –

Standardized version of factorial models (partially scalar). A. Multidimensional model. B. Bifactor model. The legend displays the symbols representing the types of variables, parameters, and relationships. For identification of both models, factor means were fixed to zero in the young group (“Y”) and freely estimated for the old group (“O”). These estimated factor means are expressed as standard deviation units. For example, the factor mean for WM indicates that the old group’s performance was .55 SD lower than the young group (p < .001). Numbers in red denote significant age differences in the factor means (p < .05). In these models, factor variances/covariances, factor means, and residual variances were freely estimated. For simplicity of the figure, the model does not show residual variances and, in the case of bifactor model, neither observed intercepts. Abs.C: abstraction capacity; BDS: backwards digit span; CF: common factor; CI: conflicting instructions; GNG: Go-No Go; IC1: verbal inhibitory control, 1st trial; IC2: verbal inhibitory control, 2nd trial; IC3: verbal inhibitory control, 3rd trial, M.Inh: motor inhibition; MP: motor programming; SWM: spatial working memory; O: old, PI1: proverb interpretation, 1st trial; PI2: proverb interpretation, 2nd trial; PI3: proverb interpretation, 3rd trial; V.Inh: verbal inhibition; VWM: verbal working memory; WM: working memory; Y: young.
