Figure 4:

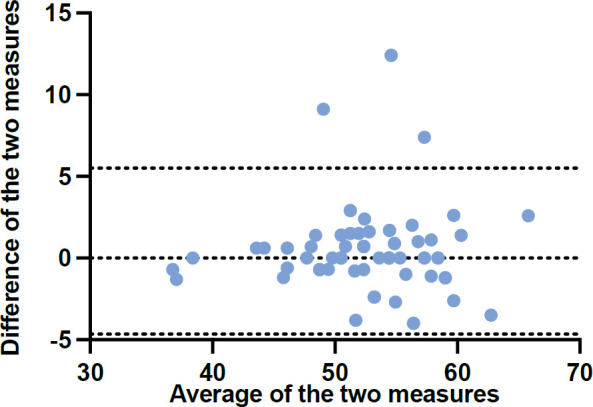
Bland-Altman plot of PLUS-M™/Nepali-12SF. Note: Average of test and retest (x-axis) plotted against difference between test and retest (y-axis). Limits of agreement are represented as dotted lines.

Bland-Altman plot of PLUS-M™/Nepali-12SF. Note: Average of test and retest (x-axis) plotted against difference between test and retest (y-axis). Limits of agreement are represented as dotted lines.