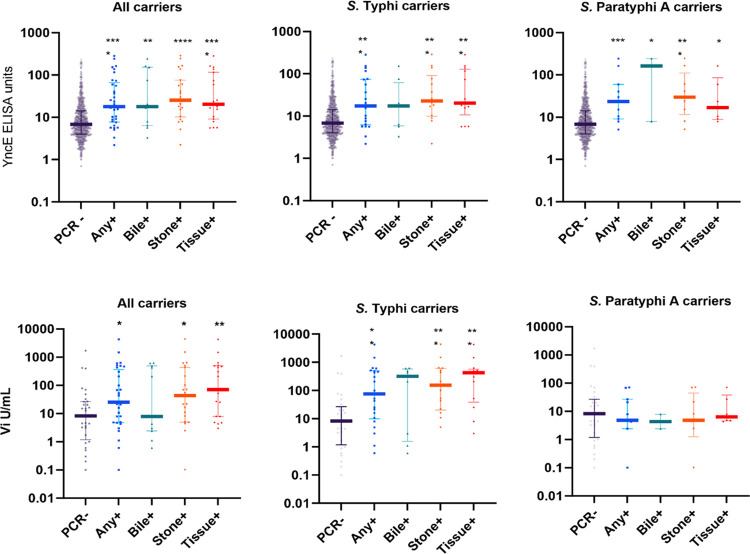
Fig 4. Distribution of anti-YncE and Vi levels by PCR status and site of positivity.
Data are shown as median with IQR. + = PCR positive, Any + = PCR positive by any sample type (bile, gallstone, or gall bladder tissue). Statistical analysis by Mann Whitney U test. * p<0.05; ** p<0.01 ***p<0.001; ****p<0.0001.

