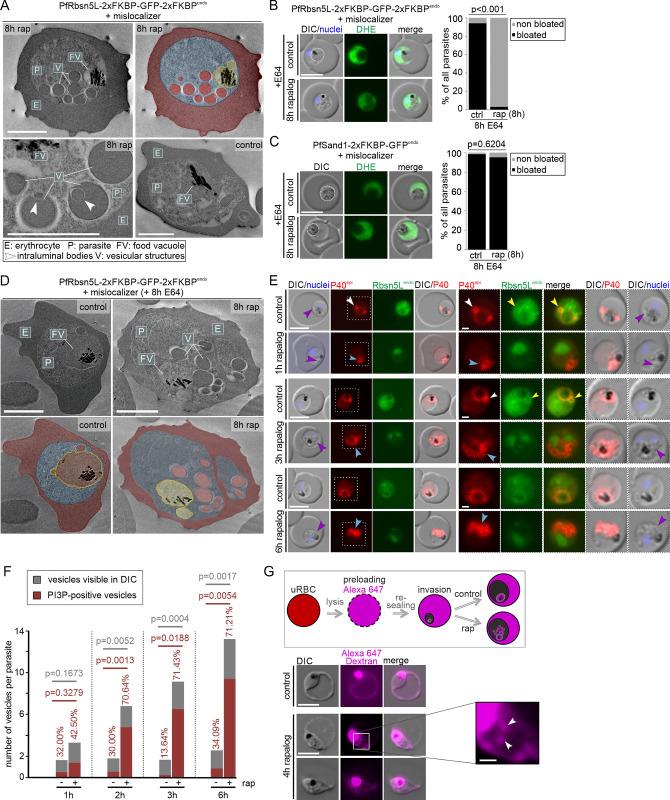
Fig 2. Vesicular structures after PfRbsn5L-inactivation are host cell cytosol uptake intermediates.
(A) Electron microscopy images of PfRbsn5L knock-sideways (8 h rap) and control parasites. One representative image of n = 42 (rapalog) and 32 (control) cells. Top right shows the top left image with false coloring. E, erythrocyte (red); P, parasite (blue); FV; food vacuole (yellow); V; vesicular structure (red). White arrows indicate putative intraluminal bodies. Scale bars, 2 μm. (B, C) Live-cell images of PfRbsn5L (B) and PfSand1 (C) knock-sideways (rap+) and controls (ctrl) in parasites treated with E64 (E64+). Left: Live-cell images of representative DHE-stained parasites. Right: Quantification of number of cells with bloated FVs. Fisher’s exact test. Pooled from n = 3 independent experiments with PfRbsn5L: 20, 26, and 22 cells (control) and 22, 20, and 20 cells (rapalog), and PfSand1endo: 22, 21, and 21 cells (control) and 29, 18, and 23 cells. P-values indicated. Rapalog was added in young trophozoites (see Materials and methods). (D) Electron microscopy images of PfRbsn5L-knock-sideways (8h rap) and control parasites treated 8 h with E64. False coloring and labels as in (B). Scale bars, 2 μm. (E) Live-cell images of PfRbsn5L knock-sideways (1 h, 2 h, 3 h, and 6 h rapalog) and control parasites, co-expressing the mScarlet tagged PI3P marker P40 (P40epi). White arrows: PI3P positive structures adjacent to the food vacuole. Yellow arrows: PfRbsn5L signal at circular structure adjacent to the food vacuole. Blue arrows: accumulations of PI3P near the food vacuole. Purple arrows: overlap of PI3P signal with the vesicle-like structures visible in the DIC. Merge, overlay of red and green channels. Areas in dashed boxes are magnified on the right. (F) Quantification of the number of vesicles in DIC (gray) and the number of PI3P positive vesicles (red) of cells imaged in (E). Pooled from n = 2 independent experiments with 15 (1 h), 11 (2 h), 13 (3 h), and 17 (6 h) (control) and 12 (1 h), 16 (2 h), 13 (3 h), and 15 (6 h) cells (rapalog), respectively. Two-tailed unpaired t test; p-values indicated. (G) Top: Schematic illustration of the experiment: RBCs are preloaded with fluorescent dextran (Alexa647); parasites invade and develop within preloaded RBCs cultivated in the presence or absence of rapalog (rap). Bottom: Live-cell images of preloaded infected RBCs with PfRbsn5L knock-sideways (4 h rapalog) and control parasites. White arrows: vesicular structures positive for Alexa647 dextran. Scale bar, 5 μm and 1 μm in the magnifications. Nuclei were stained with DAPI. DIC, differential interference contrast; endo, endogenous; epi, episomal; PfSand1endo, 2xFKBP-GFP tagged PfSand1 expressed from the endogenous locus [30]. The data underlying this figure can be found in S1 Data.

