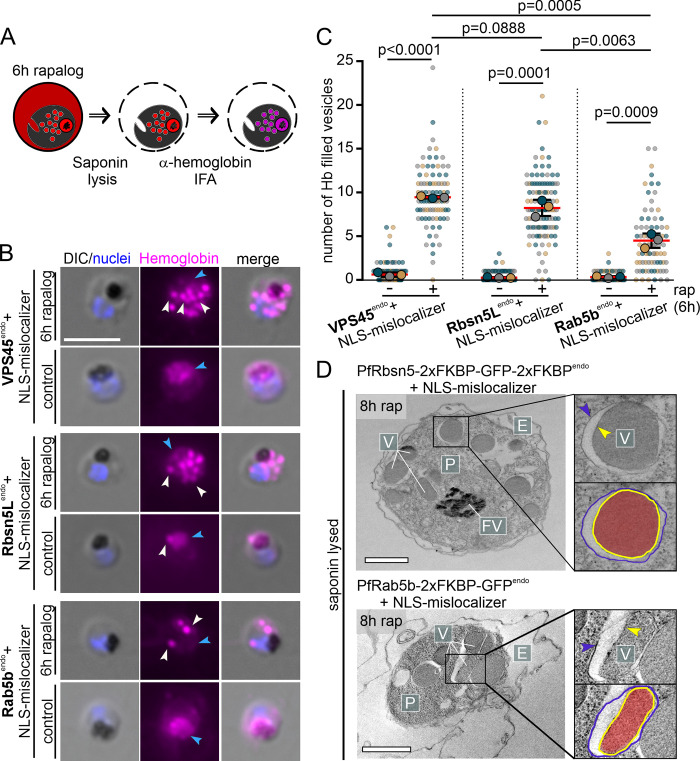
Fig 4. PfRbsn5L, PfVPS45, and PfRab5b inactivation-induced vesicles are hemoglobin-filled and not connected to the host cell.
(A) Schematic illustration of experimental procedure for IFA after saponin treatment. (B) Microscopy images of α-hemoglobin (Hemoglobin) IFAs of formaldehyde-fixed, PfVPS45endo, PfRbsn5Lendo, and PfRab5bendo knock-sideways (6 h rapalog) and control parasites (cell lines indicated). White arrows: accumulated hemoglobin positive signals, blue arrows: DV. Nuclei were stained with DAPI. DIC, differential interference contrast. Scale bar, 5 μm. (C) Quantification of hemoglobin positive foci per cell 6 h after induction of the knock-sideways (rap) from B. Superplot from n = 3 independent experiments with PfVPS45: 32, 31, and 39 cells (control) and 24, 29, and 34 cells (rapalog), PfRbsn5L: 27, 60, and 49 cells (control) and 23, 44, and 47 cells (rapalog) and PfRab5b: 24, 24, and 20 cells (control) and 26, 32, and 21 cells (rapalog), respectively; small dots show individual cells, large dots show the mean, color-coded by experiment; two-tailed unpaired t test of the means, p-values indicated; mean, red bar; error bars, black (SD). (D) Electron microscopy images of saponin-treated PfRbsn5L and PfRab5b knock-sideway parasites (8 h rap). Representatives of n = 12 (PfRbsn5L) and 50 cells (PfRab5b). E, erythrocyte; P, parasite; FV; food vacuole; V; vesicular structure. Scale bars, 2 μm. The data underlying this figure can be found in S1 Data.

