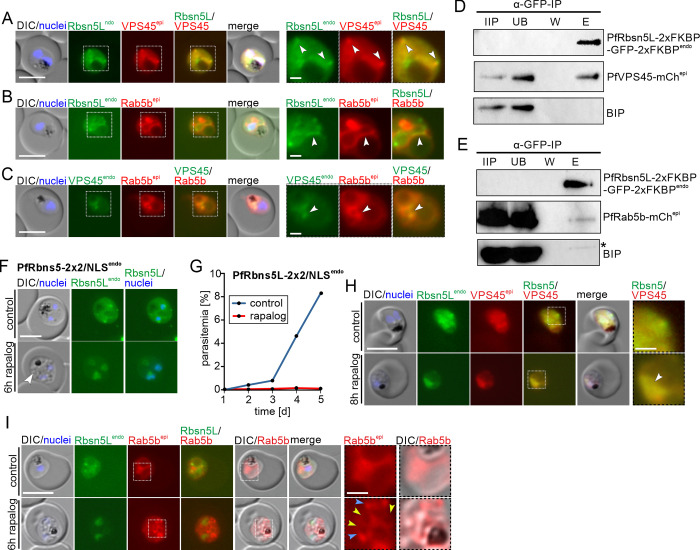
Fig 5. PfRab5b and PfVPS45 interact with PfRbsn5L.
(A–C) Live-cell microscopy images of trophozoites of PfRbsn5Lendo parasites co-expressing PfVPS45epi (A), PfRab5bepi (B) or VPS45endo parasites, co-expressing PfRab5bepi (C). White arrows: overlapping of PfRbsn5Lendo or PfVPS45endo and PfRab5bepi signals. Other stages of A–C shown in S3 Fig. (D, E) Immunoprecipitation (IP) of PfRbsn5Lendo parasites co-expressing PfVPS45epi (D) or PfRab5bepi (E). IIP, IP-input extract; UB, unbound (total extract after IP); W, last wash; E, eluate. Asterisk on BIP blot shows degradation band of GFP-fusion protein from previous exposure (replicas and full blots in S4 and S5 Figs and S1 Raw Images). One representative of n = 3 independent experiments (all replicas and complete blots shown in S4 and S5 Figs). (F, G) Validation of system for knock-sideways of a POI (PfRbsn5L) with a single integrated plasmid (PfRbsn5L-2xFKBP-GFP-2xFKBPendo_nmd3’NLS-FRB-T2A-hDHFR, named PfRbsn5L-2x2/NLSendo parasites). Live-cell images (F) and flow cytometry-based growth curve over 2.5 growth cycles (G) of induced knock-sideways of PfRbsn5L (rapalog) and control in these parasites. Growth experiment shows 1 representative of n = 3 independent experiments, all replicas shown in S1H Fig. Arrow, induced vesicles. (H) Live-cell microscopy images of PfRbsn5L knock-sideways (8 h rapalog) and controls using the PfRbsn5L-2x2/NLSendo parasites co-expressing PfVPS45epi. Representative images of n = 10 (control) and n = 15 (rapalog) cells. White arrow: Localization of PfVPS45 and PfRbsn5L to the nucleus upon PfRbsn5L inactivation. (I) Live-cell microscopy images of PfRbsn5L knock-sideway (6 h rapalog) and controls of PfRbsn5L-2x2/NLSendo parasites co-expressing PfRab5bepi. Yellow arrows: PfRab5bepi signal surrounding vesicles observed by DIC. Blue arrows: PfRab5b accumulations. Representative images of n = 2 independent experiments with 11, 5 (control) and 19, 11 (6 h rapalog) cells. Dashed boxes in the images in A–C, H, and I are shown as magnification on the right. DIC, differential interference contrast; endo, endogenous; epi, episomal. The scale bars, 5 μm and 1 μm in the magnifications. Nuclei were stained with DAPI. The data underlying this figure can be found in S1 Data.

