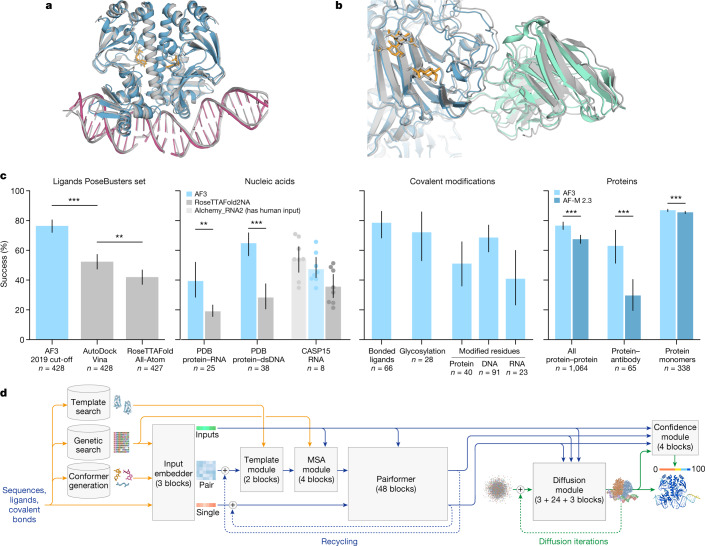
Fig. 1. AF3 accurately predicts structures across biomolecular complexes.
a,b, Example structures predicted using AF3. a, Bacterial CRP/FNR family transcriptional regulator protein bound to DNA and cGMP (PDB 7PZB; full-complex LDDT47, 82.8; global distance test (GDT)48, 90.1). b, Human coronavirus OC43 spike protein, 4,665 residues, heavily glycosylated and bound by neutralizing antibodies (PDB 7PNM; full-complex LDDT, 83.0; GDT, 83.1). c, AF3 performance on PoseBusters (v.1, August 2023 release), our recent PDB evaluation set and CASP15 RNA. Metrics are as follows: percentage of pocket-aligned ligand r.m.s.d. < 2 Å for ligands and covalent modifications; interface LDDT for protein–nucleic acid complexes; LDDT for nucleic acid and protein monomers; and percentage DockQ > 0.23 for protein–protein and protein–antibody interfaces. All scores are reported from the top confidence-ranked sample out of five model seeds (each with five diffusion samples), except for protein–antibody scores, which were ranked across 1,000 model seeds for both models (each AF3 seed with five diffusion samples). Sampling and ranking details are provided in the Methods. For ligands, n indicates the number of targets; for nucleic acids, n indicates the number of structures; for modifications, n indicates the number of clusters; and for proteins, n indicates the number of clusters. The bar height indicates the mean; error bars indicate exact binomial distribution 95% confidence intervals for PoseBusters and by 10,000 bootstrap resamples for all others. Significance levels were calculated using two-sided Fisher’s exact tests for PoseBusters and using two-sided Wilcoxon signed-rank tests for all others; ***P < 0.001, **P < 0.01. Exact P values (from left to right) are as follows: 2.27 × 10⁻¹³, 2.57 × 10⁻³, 2.78 × 10⁻³, 7.28 × 10⁻¹², 1.81 × 10⁻¹⁸, 6.54 × 10⁻⁵ and 1.74 × 10⁻³⁴. AF-M 2.3, AlphaFold-Multimer v.2.3; dsDNA, double-stranded DNA. d, AF3 architecture for inference. The rectangles represent processing modules and the arrows show the data flow. Yellow, input data; blue, abstract network activations; green, output data. The coloured balls represent physical atom coordinates.

