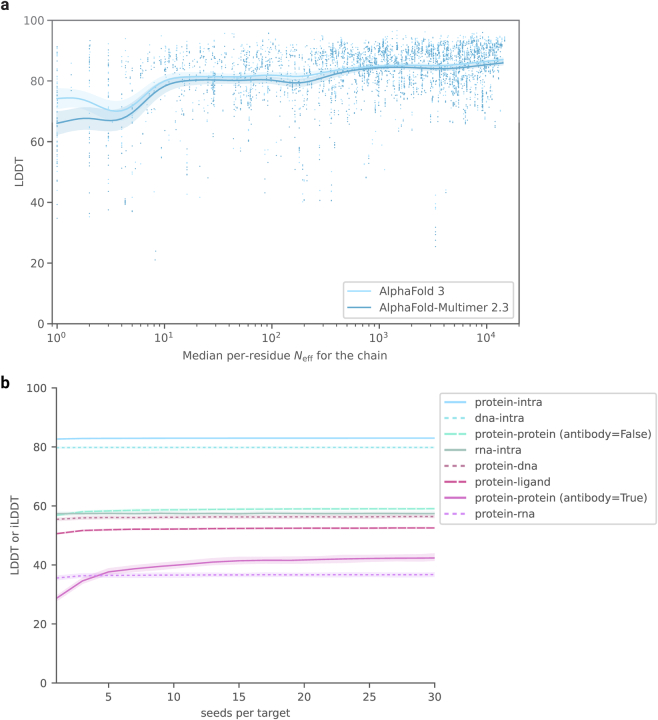
Extended Data Fig. 7. Model accuracy with MSA size and number of seeds.
a, Effect of MSA depth on protein prediction accuracy. Accuracy is given as single chain LDDT score and MSA depth is computed by counting the number of non-gap residues for each position in the MSA using the Neff weighting scheme and taking the median across residues (see Methods for details on Neff). MSA used for AF-M 2.3 differs slightly from AF3; the data uses the AF3 MSA depth for both to make the comparison clearer. The analysis uses every protein chain in the low homology Recent PDB set, restricted to chains in complexes with fewer than 20 protein chains and fewer than 2,560 tokens (see Methods for details on Recent PDB set and comparisons to AF-M 2.3). The curves are obtained through Gaussian kernel average smoothing (window size is 0.2 units in log10(Neff)); the shaded area is the 95% confidence interval estimated using bootstrap of 10,000 samples. b, Increase in ranked accuracy with number of seeds for different molecule types. Predictions are ranked by confidence, and only the most confident per interface is scored. Evaluated on the low homology recent PDB set, filtered to less than 1,536 tokens. Number of clusters evaluated: dna-intra = 386, protein-intra = 875, rnaintra = 78, protein-dna = 307, protein-rna = 102, protein-protein (antibody = False) = 697, protein-protein (antibody = True) = 58. Confidence intervals are 95% bootstraps over 1,000 samples.

