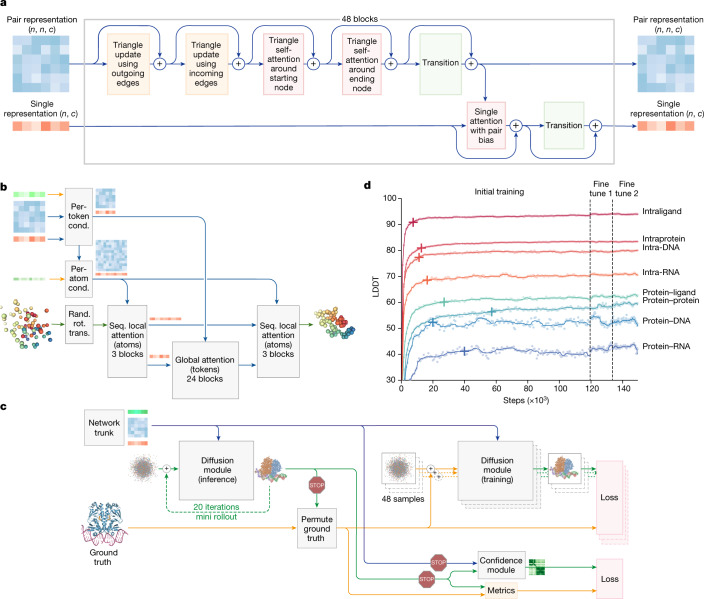
Fig. 2. Architectural and training details.
a, The pairformer module. Input and output: pair representation with dimension (n, n, c) and single representation with dimension (n, c). n is the number of tokens (polymer residues and atoms); c is the number of channels (128 for the pair representation, 384 for the single representation). Each of the 48 blocks has an independent set of trainable parameters. b, The diffusion module. Input: coarse arrays depict per-token representations (green, inputs; blue, pair; red, single). Fine arrays depict per-atom representations. The coloured balls represent physical atom coordinates. Cond., conditioning; rand. rot. trans., random rotation and translation; seq., sequence. c, The training set-up (distogram head omitted) starting from the end of the network trunk. The coloured arrays show activations from the network trunk (green, inputs; blue, pair; red, single). The blue arrows show abstract activation arrays. The yellow arrows show ground-truth data. The green arrows show predicted data. The stop sign represents stopping of the gradient. Both depicted diffusion modules share weights. d, Training curves for initial training and fine-tuning stages, showing the LDDT on our evaluation set as a function of optimizer steps. The scatter plot shows the raw datapoints and the lines show the smoothed performance using a median filter with a kernel width of nine datapoints. The crosses mark the point at which the smoothed performance reaches 97% of its initial training maximum.

