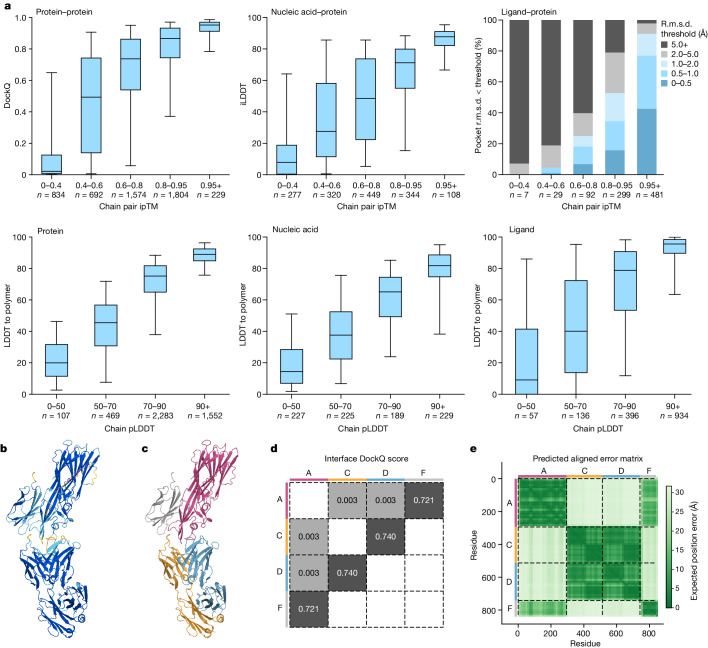
Fig. 4. AF3 confidences track accuracy.
a, The accuracy of protein-containing interfaces as a function of chain pair ipTM (top). Bottom, the LDDT-to-polymer accuracy was evaluated for various chain types as a function of chain-averaged pLDDT. The box plots show the 25–75% confidence intervals (box limits), the median (centre line) and the 5–95% confidence intervals (whiskers). n values report the number of clusters in each band. b, The predicted structure of PDB 7T82 coloured by pLDDT (orange, 0–50; yellow, 50–70; cyan, 70–90; and blue, 90–100). c, The same prediction coloured by chain. d, DockQ scores for protein–protein interfaces. e, PAE matrix of same prediction (darker is more confident), with chain colouring of c on the side bars. The dashed black lines indicate the chain boundaries.

