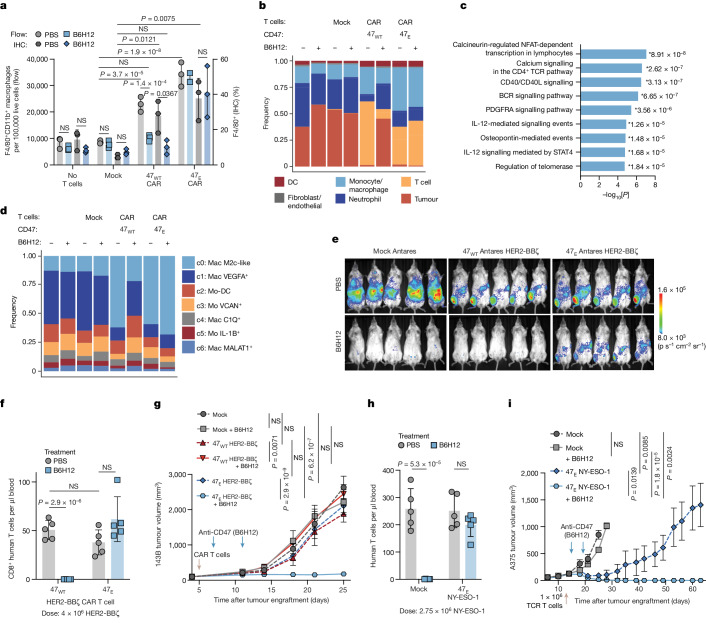
Fig. 5. 47E T cell therapy plus anti-CD47 treatment leads to enhanced antitumour efficacy through recruitment of distinct macrophage populations.
a, Macrophages identified by flow cytometry (flow; left axis) and immunohistochemistry (IHC; right axis) of excised 143B osteosarcoma tumours treated with no T cells, mock, 47WT or 47E HER2-BBζ CAR T cells with or without B6H12. Data are the mean of n = 2 (flow: 47E CAR + B6H12) or mean ± s.d. of n = 3 (all others) mice. b, The composition of cells identified using scRNA-seq from tumours treated as in a. n = 53,062 cells from 8 experimental conditions. DC, dendritic cells. c, Enrichr pathway analysis of the top 100 upregulated genes in CAR T cells from tumours treated with 47E CAR T cells + B6H12 versus 47WT CAR T cells + B6H12. The results show the P value (two-sided Fisher’s exact test) for each pathway. d, The composition of macrophage clusters (c0–c6) after subsetting and reclustering, coloured by cluster, across the experimental conditions described in a. n = 13,082 cells from 8 experimental conditions. Mac, macrophage; Mo-DC, monocyte-derived dendritic cell; Mo, monocyte. e, T cell BLI in 143B-tumour-bearing mice treated with 47WT or 47E Antares HER2-BBζ CAR T cells with or without B6H12 on day 13. Tumours were engrafted in the right leg. f, T cells in the blood of 143B-tumour-bearing mice, treated as described in e, on day 14. Data are mean ± s.d. of n = 5 mice per arm. g, 143B tumour growth after treatment as described in e. Data are mean ± s.e.m. of n = 5 mice per arm. h, T cells in the blood of A375-tumour-bearing mice, treated with 47E NY-ESO-1 TCR T cells with or without B6H12, on day 15. Data are mean ± s.d. of n = 5 mice per arm. i, A375 melanoma tumour growth treated as in h. Data are mean ± s.e.m. of n = 5 mice per arm. Statistical analysis was performed using two-way ANOVA with Tukey’s multiple-comparison test (a, b, f, g and i) and unpaired two-tailed Student’s t-tests (h).

