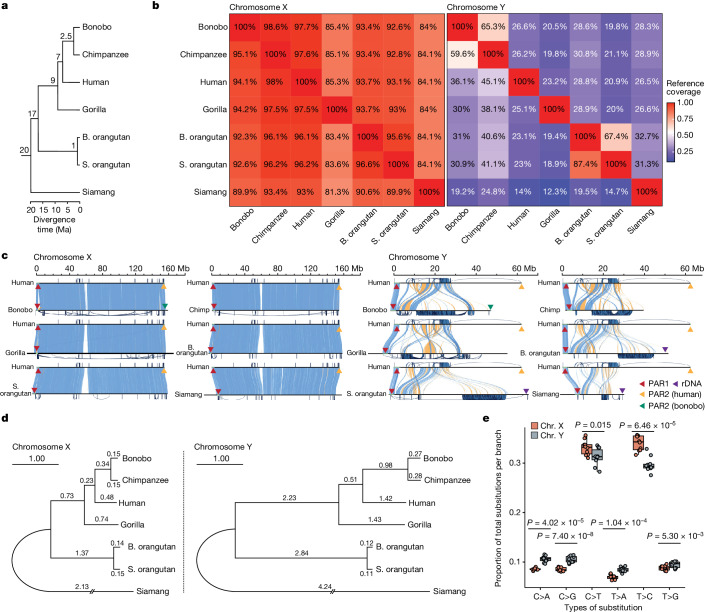
Fig. 1. Chromosome alignability and divergence.
a, The phylogenetic tree of the species in the study (see Supplementary Table 1 for references of divergence times). b, Pairwise alignment coverage of X and Y chromosomes (percentage of reference, as shown on the x axis, covered by the query, as shown on the y axis). c, Alignment of ape sex chromosomes against the human T2T assembly8,20. Blue and yellow bands indicate direct or inverted alignments, respectively. PARs and ribosomal DNA arrays (rDNA) are indicated by triangles (not to scale). Intrachromosomal segmental duplications are drawn outside the axes. The scale bars are aligned to the human chromosome. rDNA, ribosomal DNA. d, Phylogenetic trees of nucleotide sequences on the X and Y chromosomes69. Branch lengths (substitutions per 100 sites) were estimated from multi-species alignment blocks including all seven species. e, A comparison of the proportions of six single-base nucleotide substitution types among total nucleotide substitutions per branch between X and Y (excluding PARs). The distribution of the proportion of each substitution type across 10 phylogenetic branches is shown as a dot plot (all data points are plotted) over the box plot. Box plots show the median as the centre line and the first and third quartiles as bounds; the whiskers extend to the closer of the minimum and maximum value or 1.5 times the interquartile range. The significance of differences in means of substitution proportions between X and Y chromosomes for each substitution type was evaluated with a two-sided t-test on the data from all ten branches (Bonferroni correction for multiple testing was applied).

