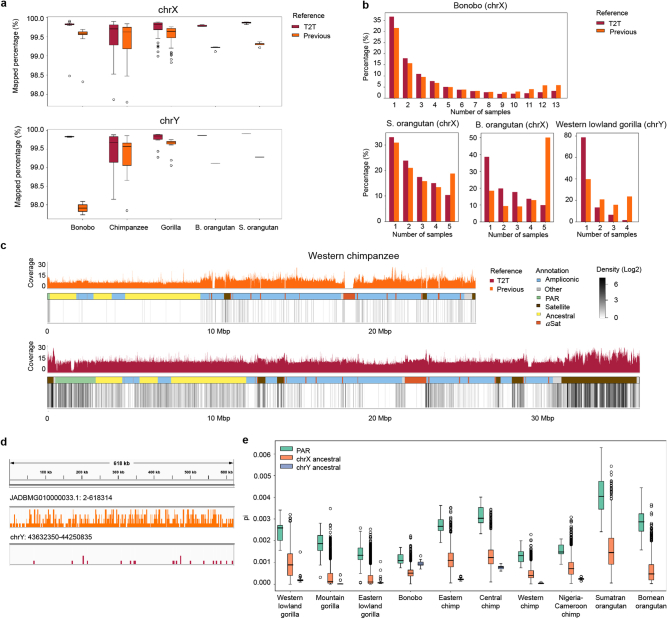
Extended Data Fig. 8. T2T assemblies facilitate short-read mapping and enable the analysis of genetic diversity in great apes.
(a) The percentage of short reads mapped to T2T vs. previous sex chromosome assemblies (using the previous reference assembly of Sumatran orangutan for Bornean orangutan data). Reads were sourced from multiple individuals per species, and the number of individuals per species and the total number of reads per species (sum of reads per individual) are listed in Table S42. The box plots show the median as the center line and the first and third quartiles as the bounds of the box; the whiskers extend to the closer of the minimum/maximum value or 1.5 times the interquartile range. Outliers (beyond the whiskers) are plotted as individual points. (b) Allele frequencies (y-axis) of variants called from reads mapped to T2T vs. previous assemblies. (c) Coverage and variant density (in log2 values of densities per 10 kb) distribution across previous (shown in the reverse orientation) and T2T assemblies for western chimpanzee. Peak variant densities were observed at 5.9 for previous chrY and at 7.6 for T2T chrY. (d) Distributions of variant allele frequencies on JADBMG010000033.1 (positions 2 to 618,314, upper), a contig from a previous chrY assembly, and T2T chrY (positions 43,632,350 to 44,250,835, bottom), for western lowland gorilla, visualized using IGV. (e) Nucleotide diversity (pi)128 in pseudoautosomal regions (PARs), ancestral regions of chromosome X, and ancestral regions of chromosome Y. ‘Chimp’ stands for chimpanzee. Variants for the calculation of pi were called for multiple individuals per subspecies, and the number of individuals per subspecies and the total number of variants per region (sum of variants per individual) are listed in Table S42. The box plots were plotted as in a.

