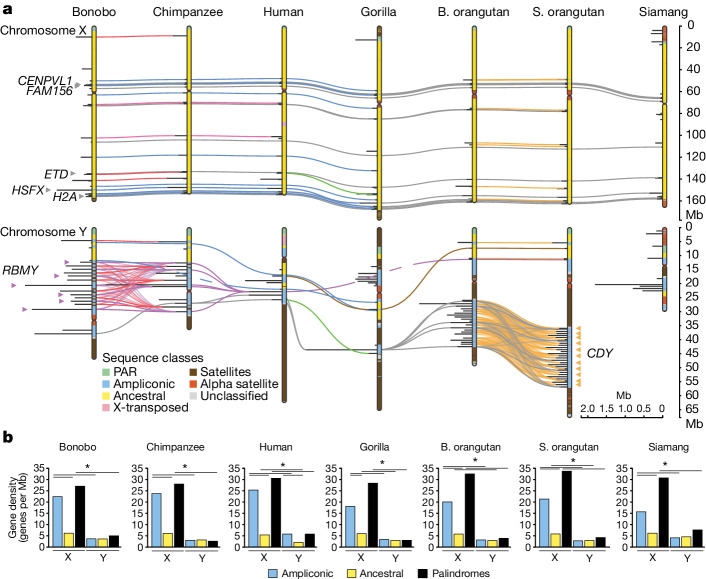
Fig. 3. Conservation of palindromes and gene density in different sequences classes.
a, Palindromes are shown as horizontal lines perpendicular to the chromosomes (painted with sequence classes); palindromes shared among species are connected by coloured lines (different colours are used for unique species combinations, may be dashed when horizontally passing through species without sharing, opacity reduced in regions with dense palindrome sharing). Several gene families that expanded in lineage-specific palindromes on the Y (CDY and RBMY) and that are present in palindromes shared among species on the X chromosome (CENPVL1, FAM156, ETD, HSFX and H2A) are indicated. See Supplementary Tables 36, 37, 38 and 41 for the original data. b, Gene density for different sex chromosome sequence classes. The significance of differences in gene densities was computed using goodness of fit (chi-squared) test with Bonferroni correction for multiple tests. Asterisks indicate significant differences in gene density (P < 0.05). See Supplementary Table 38 for the original data and P values. An interactive version of this plot can be found at https://observablehq.com/d/6e3e88a3e017ec21.

