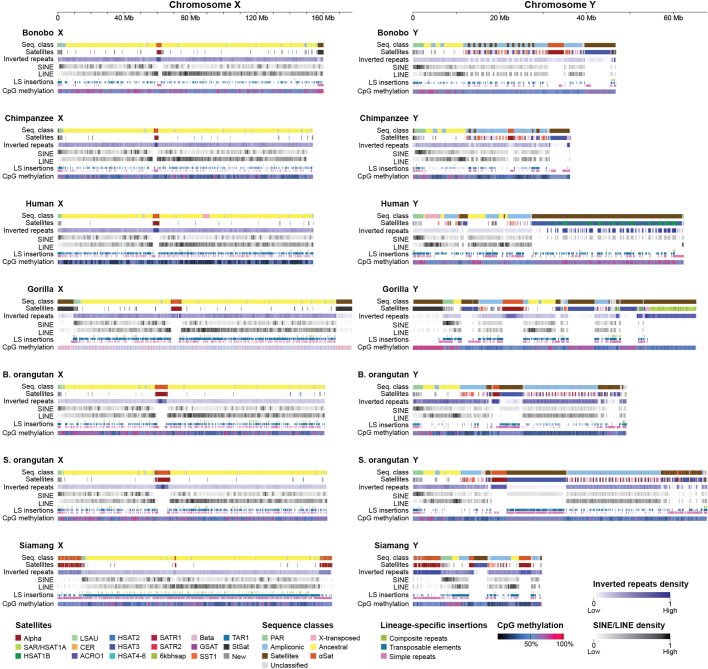
Extended Data Fig. 2. Repeats and satellites on the X and Y chromosomes.
Repeats and satellites shown with sequence class annotations and CpG methylation for chromosomes X and Y. The scales are different between chromosomes X and Y. The tracks for each species are: (1) sequence class annotation, (2) satellites, (3) inverted repeats, (4) SINEs, (5) LINEs, (6) lineage-specific (LS) insertions of composite repeats (green), transposable elements (blue), and satellites, simple repeats, and low-complexity repeats (pink), and (7) CpG methylation. The inverted repeat, SINE, and LINE tracks are plotted in blocks with darker colors representing a higher density (density values are calibrated independently for each chromosome/species). CpG methylation is also displayed on a gradient between dark blue (low methylation) and magenta (high methylation) based on the percentage of supporting aligned ONT reads. The remaining tracks (sequence class, satellites, and LS insertions) are displayed as presence/absence (color/no color). The class and satellite tracks are discrete, whereas the LS insertions are plotted as mini tracks to avoid overplotting where >1 label applies.

