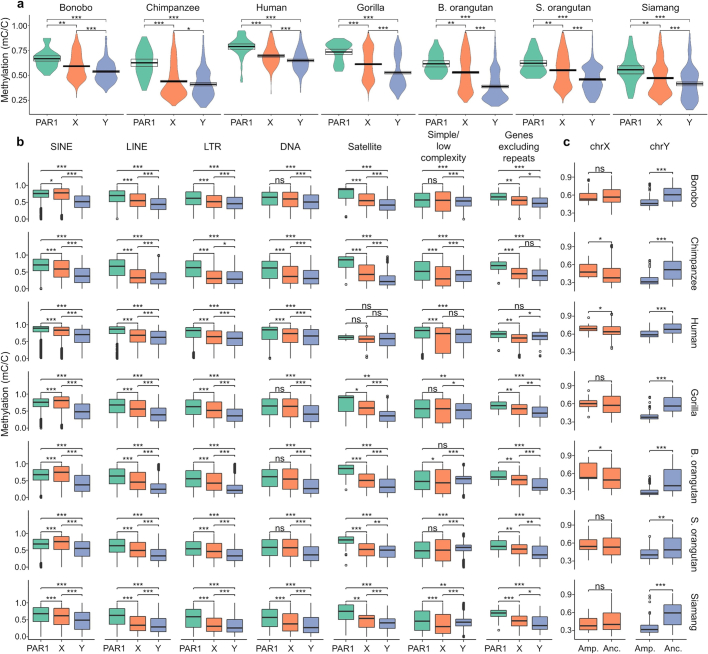
Extended Data Fig. 3. Methylation patterns.
(a) DNA methylation levels in 100-kb bins in Pseudoautosomal region 1 (PAR1; teal), non-PAR chromosome X (orange), and non-PAR chromosome Y (periwinkle). (b) Differences in DNA methylation levels between different repeat categories as well as protein-coding genes (after excluding repetitive sequences). (c) Differences in methylation levels between ampliconic and ancestral regions in the X and the Y chromosomes (in 100 kb bins). All box plots (a-c) show the median and first and third quartiles. Those in b-c also have whiskers extending to the closer of the minimum/maximum value or 1.5 times the interquartile range, and outliers (beyond the whiskers) are plotted as individual points. p-values were determined using two-sided Wilcoxon rank-sum tests (* p < 0.05; ** p < 10−3; *** p < 10−6) and are shown in Table S28. No correction for multiple testing was applied. Sample sizes (i.e., number of 100 kb bins (a,c) or number of repeats, genes, etc. (b)) are shown in Table S28.

