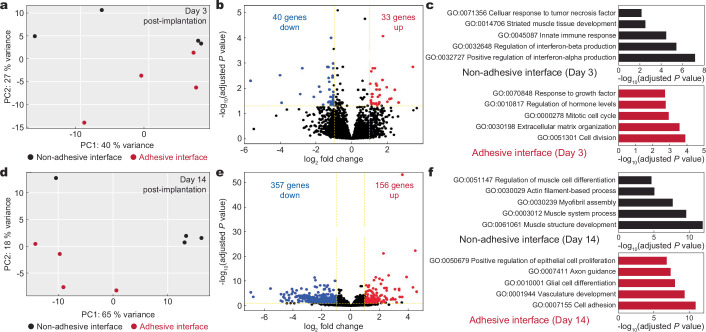
Extended Data Fig. 8. Transcriptomic analysis of adhesive and non-adhesive implant-tissue interfaces.
a, Principal component analysis (PCA) plot illustrating the variances of the adhesive (red dots, n = 4) and non-adhesive (black dots, n = 4) implant-tissue interface dataset collected on day 3 post-implantation to the abdominal wall. b, Volcano plot displaying the gene expression profiles for the non-adhesive and adhesive implant-tissue interfaces collected on day 3 post-implantation to the abdominal wall. Coloured (blue and red) data points represent genes that meet the threshold of fold change (FC) above 1 or under −1, false discovery rate (FDR) < 0.05. Blue and red coloured dots indicate down- and up-regulated genes in the adhesive implant-tissue interface compared to the non-adhesive implant-tissue interface, respectively. c, Top five enriched processes from Gene Ontology (GO) enrichment analysis of differentially expressed genes in the non-adhesive (black) and adhesive (red) implant-tissue interfaces collected on day 3 post-implantation to the abdominal wall. d, PCA plot illustrating the variances of the adhesive (red dots, n = 4) and non-adhesive (black dots, n = 4) implant-tissue interface dataset collected on day 14 post-implantation to the abdominal wall. e, Volcano plot displaying the gene expression profiles for the non-adhesive and adhesive implant-tissue interfaces collected on day 14 post-implantation to the abdominal wall. Coloured (blue and red) data points represent genes that meet the threshold of fold change (FC) above 1 or under −1, false discovery rate (FDR) < 0.05. Blue and red coloured dots indicate down- and up-regulated genes in the adhesive implant-tissue interface compared to the non-adhesive implant-tissue interface, respectively. f, Top five enriched processes from Gene Ontology (GO) enrichment analysis of differentially expressed genes in the non-adhesive (black) and adhesive (red) implant-tissue interfaces collected on day 14 post-implantation to the abdominal wall. The P values were determined by one-sided Fisher’s exact test and adjusted by Storey’s correction method.

