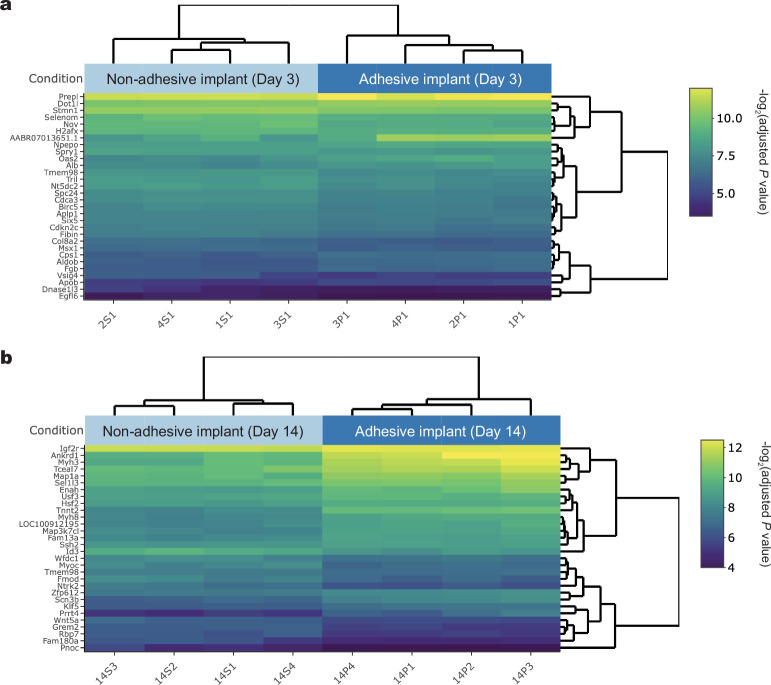
Extended Data Fig. 9. Visualization of RNA sequencing results.
a,b, Bi-clustering heatmap to visualize the expression profiles of the top 30 differentially expressed genes sorted by their adjusted P value by plotting their log2 transformed expression values in samples day 3 (a) and day 14 (b) post-implantation. Dendrograms were drawn from Ward hierarchical clustering. The P values were determined by one-sided Fisher’s exact test and adjusted by Storey’s correction method.

