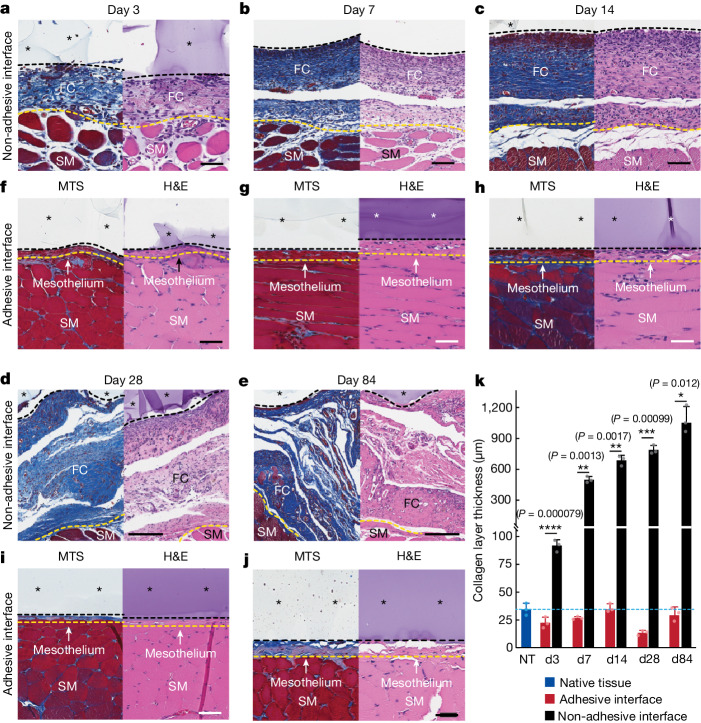
Fig. 2. Histology analysis of the adhesive and non-adhesive implant–tissue interfaces at different time points.
a–e, Representative histology images stained with Masson’s trichrome (left) and haematoxylin and eosin (right) of the non-adhesive implant collected on day 3 (a), day 7 (b), day 14 (c), day 28 (d) and day 84 (e) post-implantation on the abdominal wall. f–j, Representative histology images stained with Masson’s trichrome (left) and haematoxylin and eosin (right) of the adhesive implant collected on day 3 (f), day 7 (g), day 14 (h), day 28 (i) and day 84 (j) post-implantation on the abdominal wall. Asterisks in images indicate the implant; black dashed lines in images indicate the implant–tissue interface; yellow dashed lines in images indicate the mesothelium–fibrous capsule (non-adhesive implant) or the mesothelium–skeletal muscle (adhesive implant) interface. SM, skeletal muscle; FC, fibrous capsule. k, Collagen layer thickness at the implant–tissue interface measured at different time points post-implantation. The blue dashed line indicates the average collagen layer thickness of the native tissue (NT). d, day. Values in k represent the mean and the standard deviation (n = 3 implants; independent biological replicates). Statistical significance and P values were determined by two-sided unpaired t-tests; *P < 0.05; **P ≤ 0.01; ***P ≤ 0.001; ****P < 0.0001. Scale bars, 50 μm (a,f–j), 100 μm (b,c), 200 μm (d,e).

