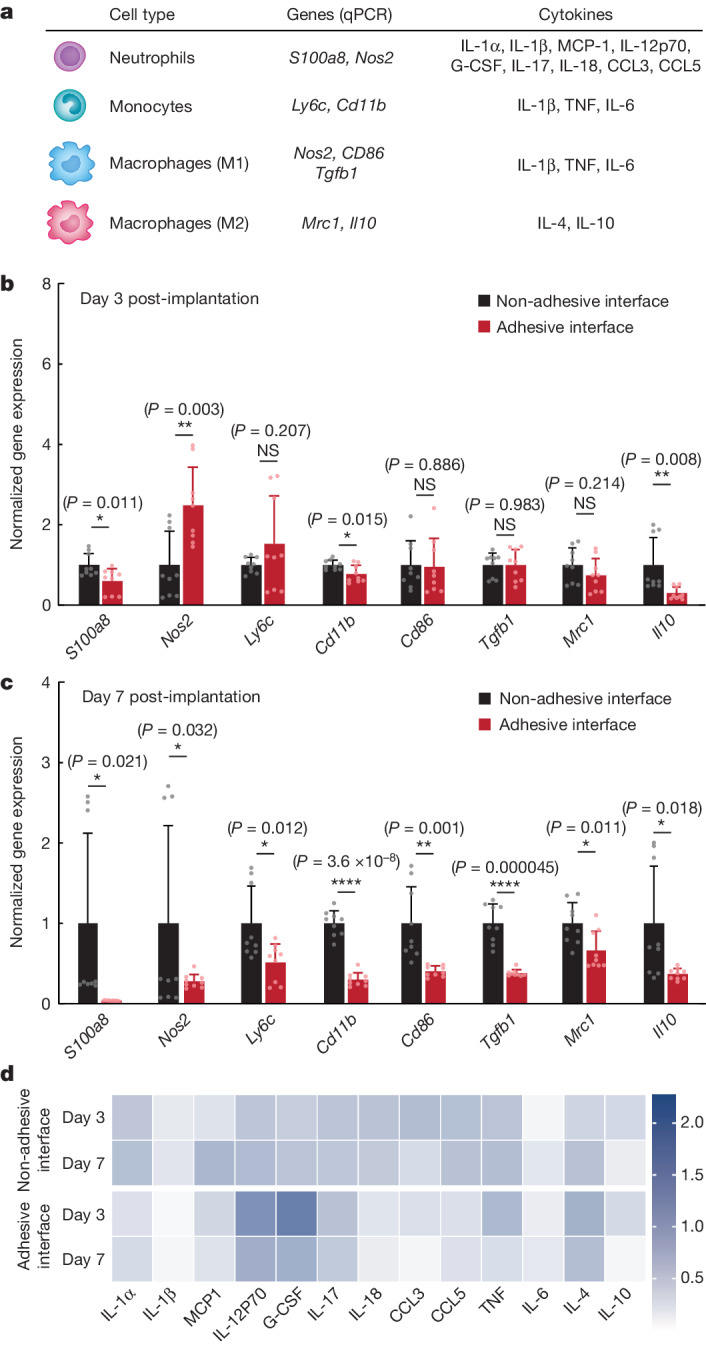
Fig. 4. qPCR and Luminex analysis of the adhesive and non-adhesive implant–tissue interfaces.

a, Genes and cytokines relevant to each cell type in the qPCR and Luminex studies. b,c, Normalized gene expression of immune-cell-related markers for the non-adhesive and the adhesive implant–tissue interface collected on day 3 (b) and day 7 (c) post-implantation on the abdominal wall. d, Heat map of immune-cell-related cytokines measured with Luminex assay of the non-adhesive and the adhesive implant–tissue interfaces collected on days 3 and 7 post-implantation on the abdominal wall. Values in b,c represent the mean and the standard deviation (n = 9 implants; independent biological replicates). Statistical significance and P values were determined by two-sided unpaired t-tests; NS, not significant; *P < 0.05; **P ≤ 0.01; ****P < 0.0001.
