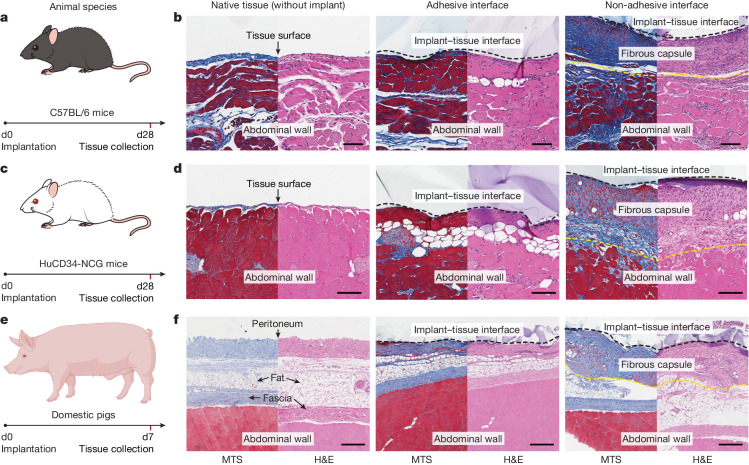
Fig. 5. Adhesive anti-fibrotic interfaces in diverse animal models.
a,c,e, Schematic illustrations for the study design in C57BL/6 mice (a), HuCD34-NCG humanized mice (c) and pigs (e). Implants are placed on the abdominal wall of the animals. b,d,f, Representative histology images stained with Masson’s trichrome and haematoxylin and eosin for native tissue (left), the adhesive implant (middle) and the non-adhesive implant (right) collected on day 28 post-implantation in C57BL/6 mice (b) and HuCD34-NCG humanized mice (d), and on day 7 post-implantation in pigs (f). Black dashed lines in images indicate the implant–tissue interface; yellow dashed lines in images indicate the fibrous capsule–tissue interface. The experiment in b,d,f was repeated independently (n = 6 per group for C57BL/6 mice; n = 5 per group for HuCD34-NCG mice; n = 4 per group for pigs) with similar results. Scale bars, 100 μm (b,d), 300 μm (f). The graphic of the pig in e was created with BioRender.com.

