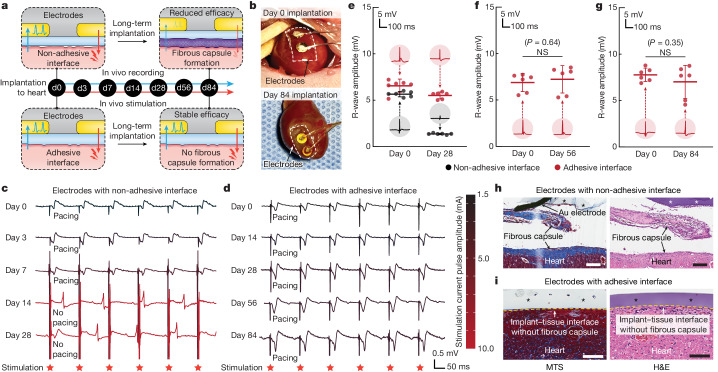
Fig. 6. Long-term in vivo bidirectional electrical communication through the adhesive anti-fibrotic interfaces.
a, Schematic illustrations for the in vivo electrophysiological recording and stimulation through implanted electrodes with the non-adhesive or the adhesive implant–tissue interface. b, Photographs of the heart collected on days 0 and 84 post-implantation for electrodes with the adhesive interface. White dashed lines in photographs indicate the boundary of implants. c, Representative epicardial electrocardiograms after stimulation through implanted electrodes with the non-adhesive implant–tissue interface on days 0, 3, 7, 14 and 28 post-implantation on a rat heart. d, Representative epicardial electrocardiograms after stimulation through implanted electrodes with the adhesive implant–tissue interface on days 0, 14, 28, 56 and 84 post-implantation on a rat heart. e–g, Recorded R-wave amplitude through implanted electrodes with the non-adhesive (black) and the adhesive (red) implant–tissue interfaces on day 28 (e), day 56 (f) and day 84 (g) post-implantation on a rat heart. Inset plots show representative recorded waveforms. h,i, Representative histology images stained with Masson’s trichrome (left) and haematoxylin and eosin (right) of the electrodes with the non-adhesive (h) and the adhesive (i) implant collected on day 28 post-implantation on a rat heart. Asterisks in images indicate the implant; yellow dashed lines in images indicate the implant–tissue interface. Values in e–g represent the mean and the standard deviation (n = 6 animals; independent biological replicates). The experiment in h,i was repeated independently (n = 6 per group) with similar results. Statistical significance and P values were determined by two-sided unpaired t-tests; NS, not significant. Scale bars, 200 μm (h), 100 μm (i).

