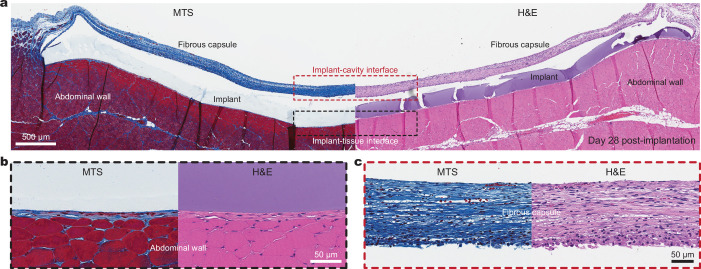
Extended Data Fig. 2. Adhesive implant histology.
a, Representative histology images stained with Masson’s trichrome (MTS, left) and haematoxylin and eosin (H&E, right) of the adhesive implant collected on day 28 post-implantation to the abdominal wall. Black and red dotted areas indicate the implant-tissue interface and the implant-abdominal cavity interface, respectively. b,c, Representative histology images stained with MTS (left) and H&E (right) of the implant-tissue interface (b) and implant-cavity interface (c) for the adhesive implant collected on day 28 post-implantation to the abdominal wall. The experiment was repeated independently (n = 4) with similar results.

