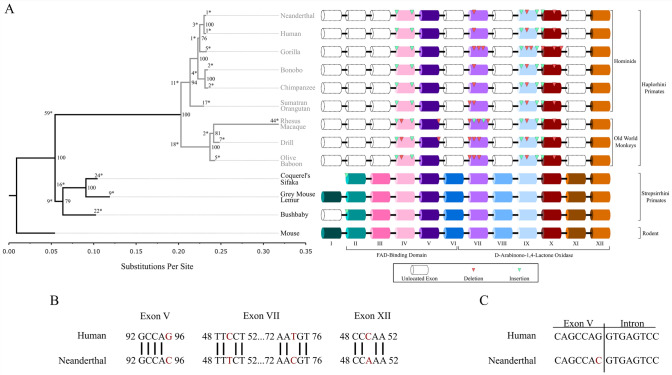
Fig. 2.
GULO and GULOP gene structure among primates: A Phylogenetic tree showing GULO evolution among the primates. GULO/GULOP sequences were aligned in MEGA 11 with the Clustal Omega tool. Substitution matrices were calculated in MEGA11 with a complete deletion option for gaps and ambiguous sites. All sequences submitted for phylogenetic analysis had all gaps and ambiguous sites deleted. Bayesian-inferred phylogenies were rendered with 250,000 iterations in MrBayes with a GTR+G substitution model. The GTR+G model was the model with the lowest AICc value. A burn-in of 25% from the cold-chain generated phylogenies was used to generate a consensus tree. The tree was rooted to Mus musculus in FigTree version 1.4.4. A scale bar representing nucleotide substitution per site is provided. Numbers distinguished with an asterisk represent conserved substitutions at a node or unique substitutions of the species from the final alignment. Numbers without asterisks are the posterior probabilities of a node which were provided by MrBayes. An exon map showing the homologous exons of GULO and GULOP is provided next to each species. Exons in white with dashed lines are not detected. Indels are shown with light and dark triangles indicating insertions or deletions, respectively. B Alignment of GULOP exon sequences where SNVs occur between Homo sapiens and Homo neanderthalensis from untrimmed alignments. SNVs are labelled relative to their position in the exon sequence, and SNVs are indicated by the absence of a vertical line. C Exon/intron border of orthologous exon V and its 3’ intron. Exon/intron analysis was performed in NNSPLICE 0.9. Scores of 1.00 and 0.99 were computed for Homo sapiens and Homo neanderthalensis, respectively

