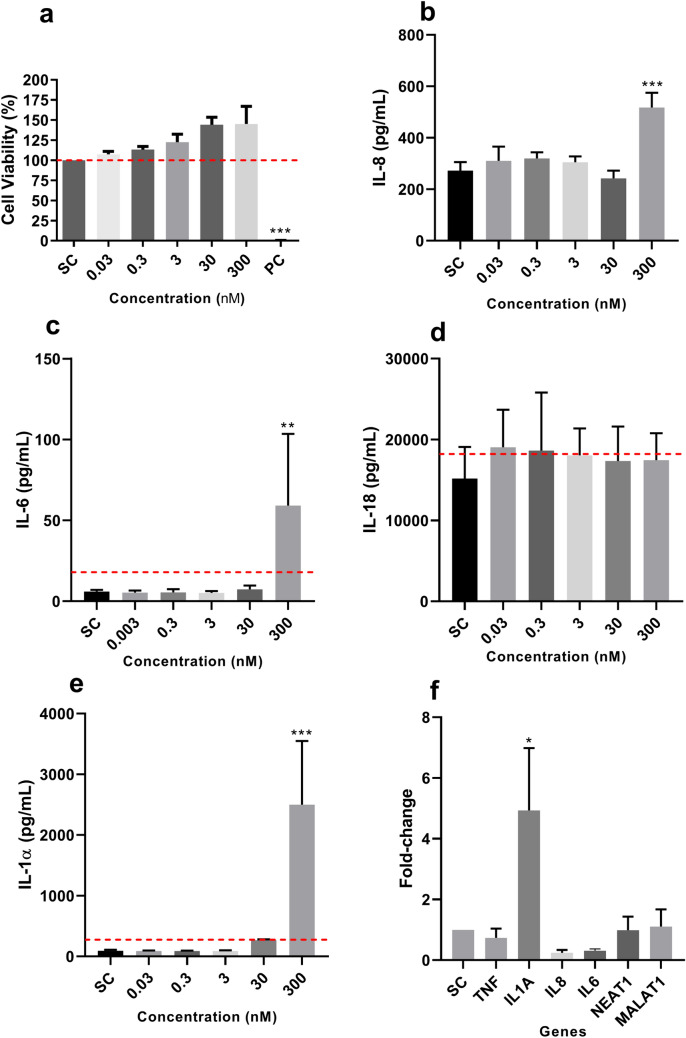
Fig. 2.
Effect of DiPeP on HaCaT cells after 24 h of exposure. a Cell viability. b–e Expression of inflammatory cytokines. f Gene expression of inflammatory cytokine genes and long non-coding RNAs in HaCaT cells exposed to DiPeP 300 nM. The dotted line in cell viability (Panel a) represents the cut-off for cytotoxicity (80% of viability); in the other panels, the dotted line represents the cut-off for being a sensitizer (Panel b: SI IL-6 ≥ 3; Panel c: SI IL-18 ≥ 1.2; Panel d: SI IL-1α ≥ 3). SC: DMSO 0.1%-v/v; PC: Triton X-100 1%-v/v. SI: stimulation index. Data are expressed as mean ± SD (Panel a); as mean ± SEM (Panels b–f). Statistical significance between treated and control cells was determined by Dunnett’s multiple comparison test as part of one-way ANOVA; for the RT-qPCR by one-way ANOVA followed by Tukey’s multiple comparisons test using ΔCT values of SC cells and DiPeP-treated cells with *p < 0.05; **p < 0.01; ***p < 0.001

