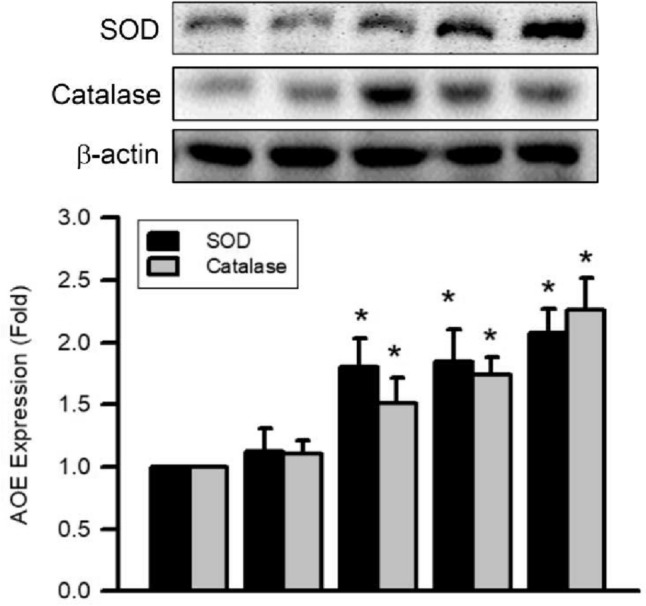
Fig. 9.

3-BrFlu-induced SOD and catalase expression in SVEC4-10 endothelial cells. Expression of SOD and catalase was measured by immunoblotting assay after treated with 3-BrFlu for 24 h. The value of 0 μM 3-BrFlu treated SVEC4-10 cells for 24 h was set to 1. The exchange in fold of SOD and catalase expression between the other treated and 0 μM 3-BrFlu-treated groups were calculated. All data are represented as the mean ± standard deviation of the mean (n = 3). Significant differences (P < 0.05) between the various treatment groups are indicated by the differential letter at the top of the columns
