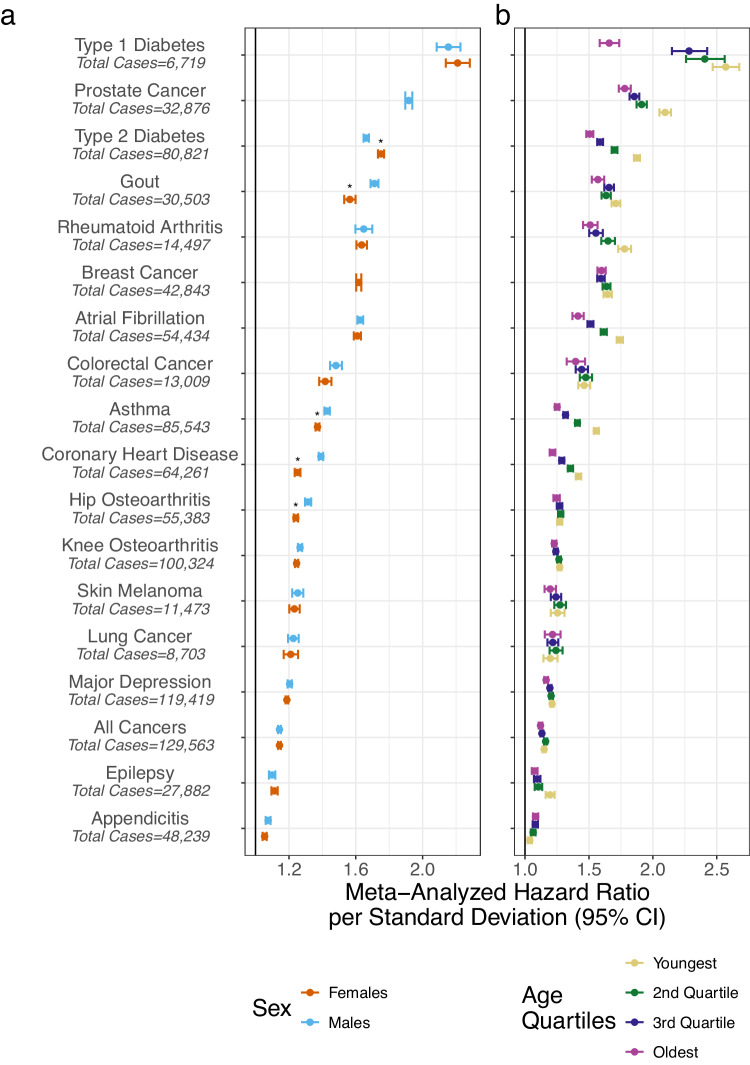
Fig. 1. Model selection for each phenotype.
a Data are presented as the fixed-effects meta-analysis of the log hazard ratios per standard deviation of PGS stratified by sex. b Meta-analysed hazard ratios per standard deviation stratified by age. The asterisk indicates a significant interaction between PGS and sex estimated by a two-sided Wald test after Bonferroni correction for multiple testing of 18 phenotypes (p value < 2.8 × 10⁻³). The exact p values are in Supplementary Table 1. Case and control sample sizes for each phenotype in each biobank are in Supplementary Data 1.

