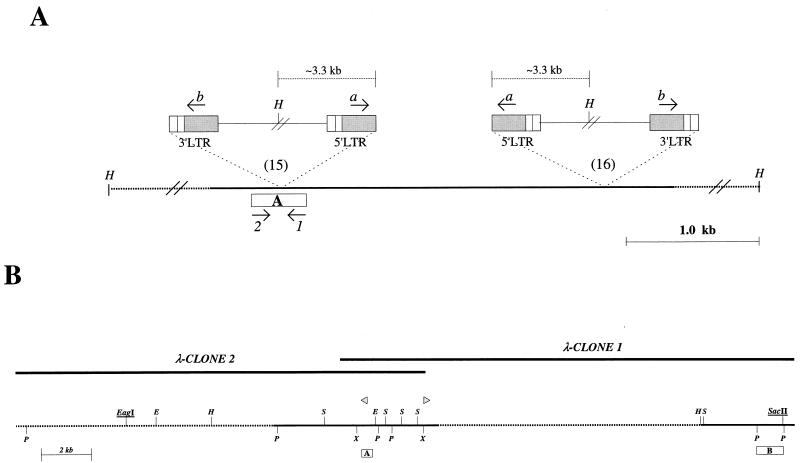
FIG. 2.
(A) Relative locations and orientations of the integrated proviruses in two independent tumors (15 and 16). Box, preintegration site PCR probe A; arrows 1 and 2, primers used to amplify probe A; arrows a and b, provirus-specific primers; H, HindIII restriction site. (B) Restriction map of the cloned Sint1 locus. Upper lines indicate the two overlapping genomic λ-phage clones, while the bottom line shows the resulting map. SacI (S), XhoI (X), PstI (P), HindIII (H), and EcoRI (E) sites are indicated. Underlined are the CpG indicator enzymes (see text). Dotted lines, regions only partly analyzed by restriction enzyme mapping and sequencing; boxes A and B, hybridization probes; triangles, provirus integration sites.

