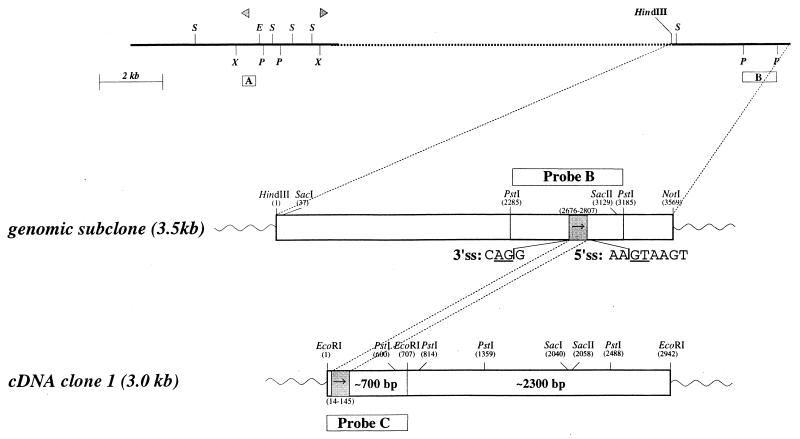
FIG. 5.
Correlation between Sint1 genomic region and Sint1 cDNA. (Top) Part of the genomic region; (middle) genomic 3.5-kb HindIII/NotI subclone; (bottom) corresponding cDNA clone. Triangles, provirus integration sites. Restriction enzyme site abbreviations are as defined for Fig. 1. Hybridization probes are shown as boxes A, B, and C. The grey box containing an arrow indicates the location and orientation of the exon in the genomic clone as well as in the cDNA clone. The 5′ and 3′ splicing signal (ss) sequences are shown with the conserved intron dinucleotides underlined.

