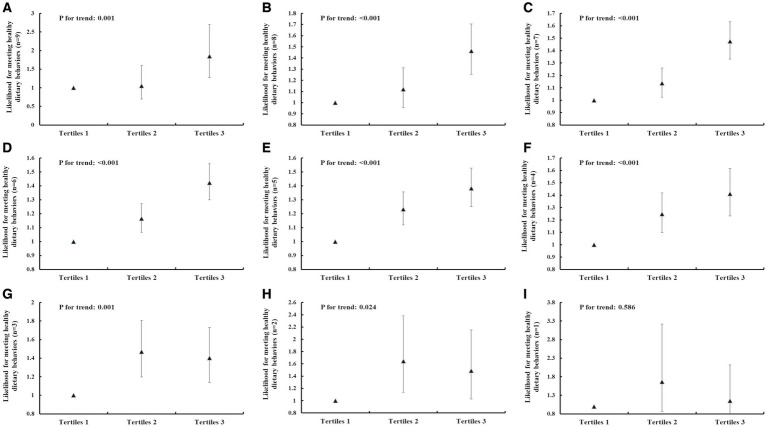
Figure 1.
The association between IHL and meeting different numbers of healthy dietary behaviors. (A) Meeting nine healthy dietary behaviors. (B) Meeting eight healthy dietary behaviors. (C) Meeting seven healthy dietary behaviors. (D) Meeting six healthy dietary behaviors. (E) Meeting five healthy dietary behaviors. (F) Meeting four healthy dietary behaviors. (G) Meeting three healthy dietary behaviors. (H) Meeting two healthy dietary behaviors. (I) Meeting one healthy dietary behaviors. The data were exhibited as odds ratios (OR) and their corresponding 95% confidence intervals (CI). Logistic regression analysis was used to calculate p values. Adjusted for sex, age (continuous variable), annual family income (<20,000, 20,000–35,000, >35,000 yuan), the place of residence, father’s education level, mother’s education level. The horizontal axis represents the tertiles of IHL.

