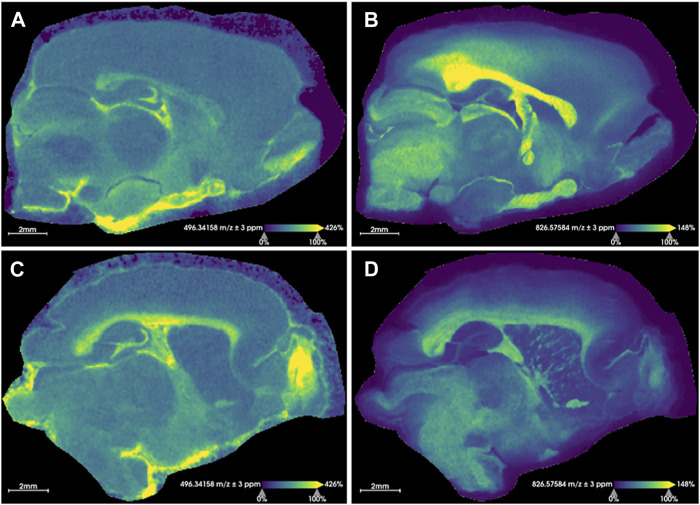
FIGURE 2.
Representative images for rat brain tissue sections. Extracted ion images resulting from sham rat tissues (A, B) and injured rats (C, D) are shown. (A, C) show the distribution of the [M + H]+ ion for LPC(16:0) (m/z 496.3416 ± 3 ppm) and (B, D) display the distribution of the [M + K]+ ion for PC(36:1) (m/z 826.5758 ± 3 ppm). These sample images demonstrate an overall relative increase of LPC(16:0) and a decrease of PC(36:1) [M + K]+ in the injured brain following rmTBI. The identity of these was confirmed with MS/MS. Root mean square normalization, hot spot removal and weak denoising were used. Both sections were collected with a step size of 50 μm × 50 µm and a 2M transient size (approximately 300,000 mass resolution at m/z 314). Acquisition time for each section was approximately 19 h.

