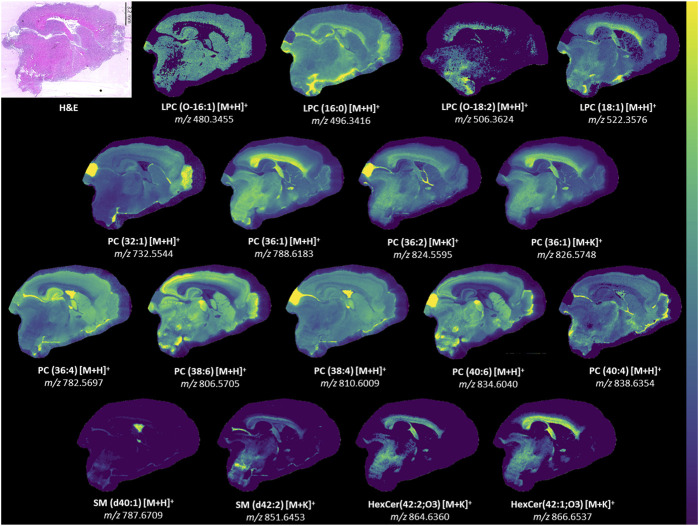
FIGURE 6.
Ion images for lipids in model. Representative ion images from one brain section besides LPC(O-18:2). The signal for LPC(O-18:2) was weak in the representative section and an image from another section is provided instead. LPC(O-18:2) distribution resembles that of LPC(18:1) but is lower in intensity. H&E-stained section to show anatomy relative to mass spectrometry images. Weak denoising was used. Mass window is ±3 ppm for all images. Step size was 50 μm × 50 µm. The section had 66052 pixels and acquisition time was approximately 23 h. A 2M transient size was used, which is approximately 300,000 mass resolution at m/z 314. All identities were confirmed with LC-MS/MS besides HexCer(42:2; O3) [M + K]+ and HexCer(42:1; O3) [M + K]+.

